LogisticsDraft
Sensoco
Fleet operations
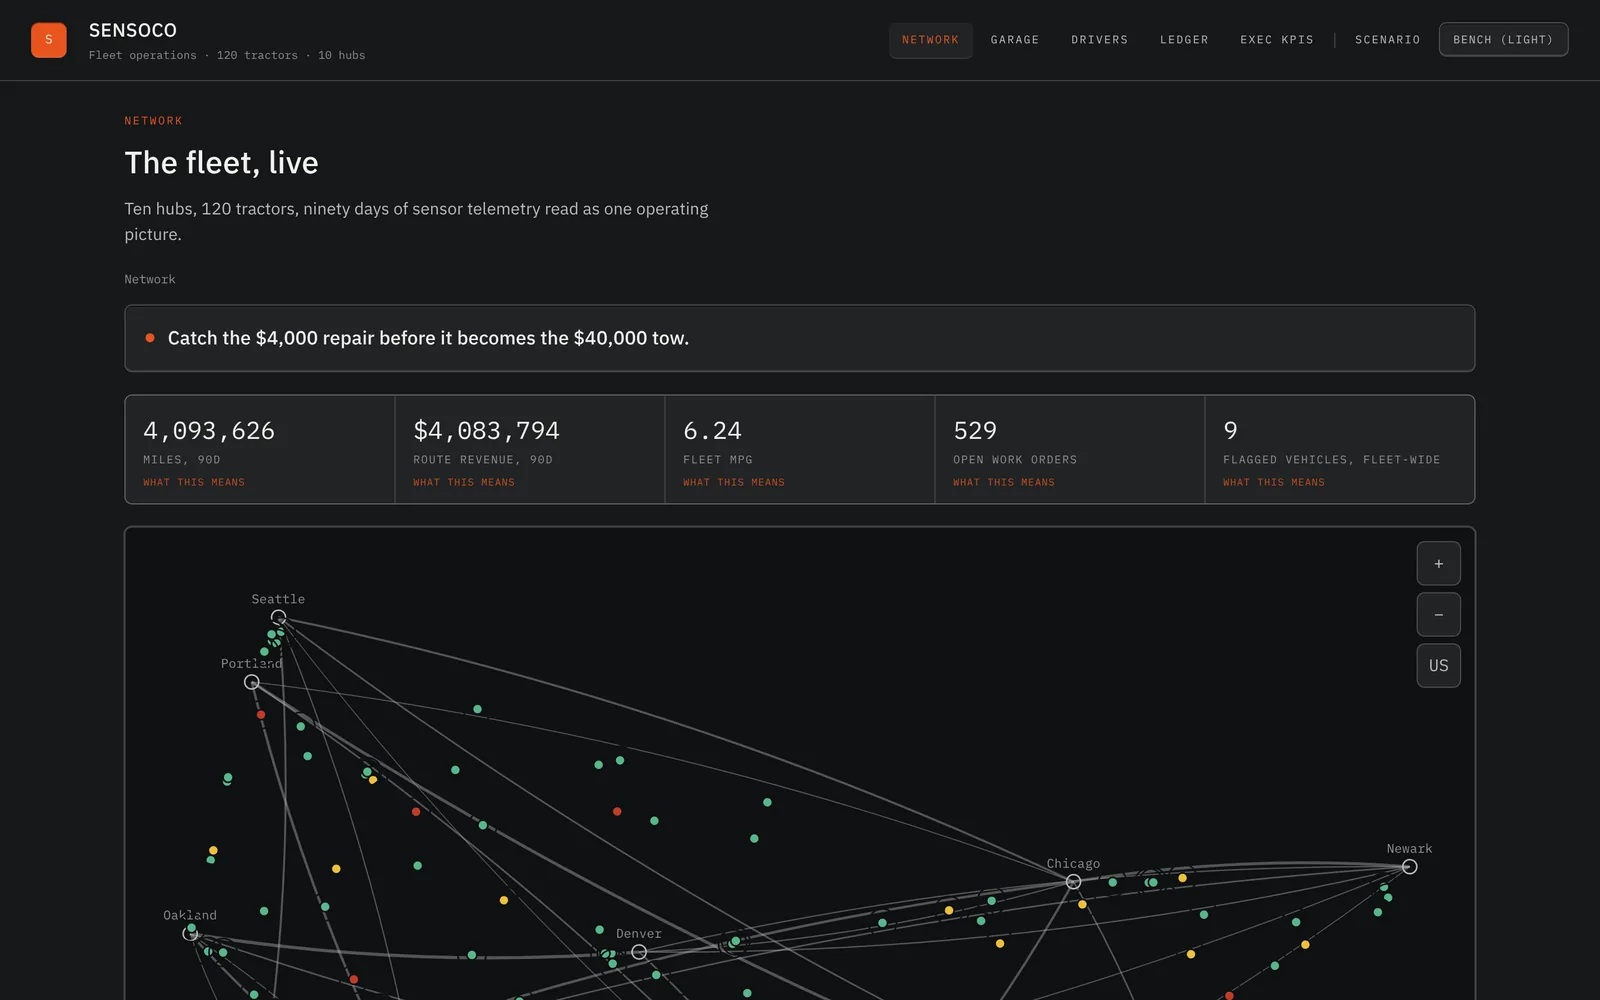
Fleet operations for a trucking company. See which trucks need maintenance, which routes make money and which drivers are at risk.
- Synthetic data
- Maintenance
- Routes and drivers
Omni Apps · Built by Astrodata
Each app starts with a decision someone makes every week and puts the answer on one screen. The screen is the part you see. Underneath is the work Astrodata does for clients every day: pipelines into Snowflake, models and metrics in dbt, and a semantic layer in Omni, so every number holds up when someone asks where it came from.
All apps
Tell us who you are once and every app opens. Apps marked Omni sign-in run on the Astrodata Omni instance; ask us for a walkthrough.
Fleet operations
Fleet operations for a trucking company. See which trucks need maintenance, which routes make money and which drivers are at risk.
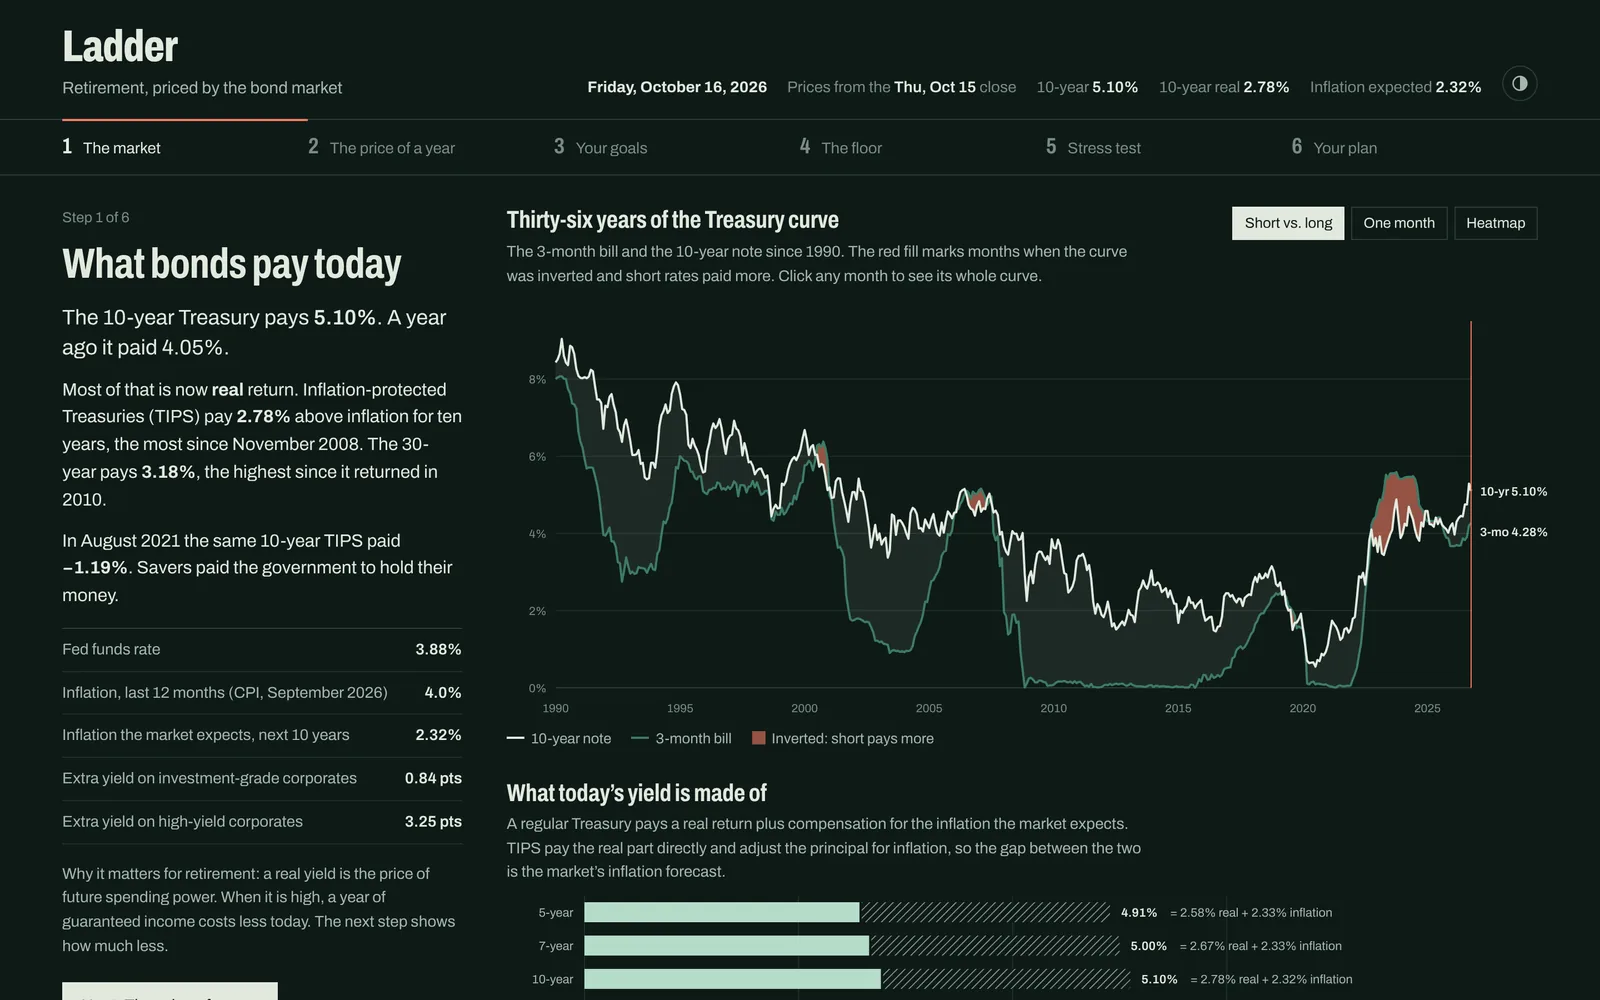
Retirement, priced by the bond market
A retirement planner built on current Treasury and TIPS rates. Enter your goals and it shows how much guaranteed income you can lock in, and how the plan would have held up in every year since 1928.
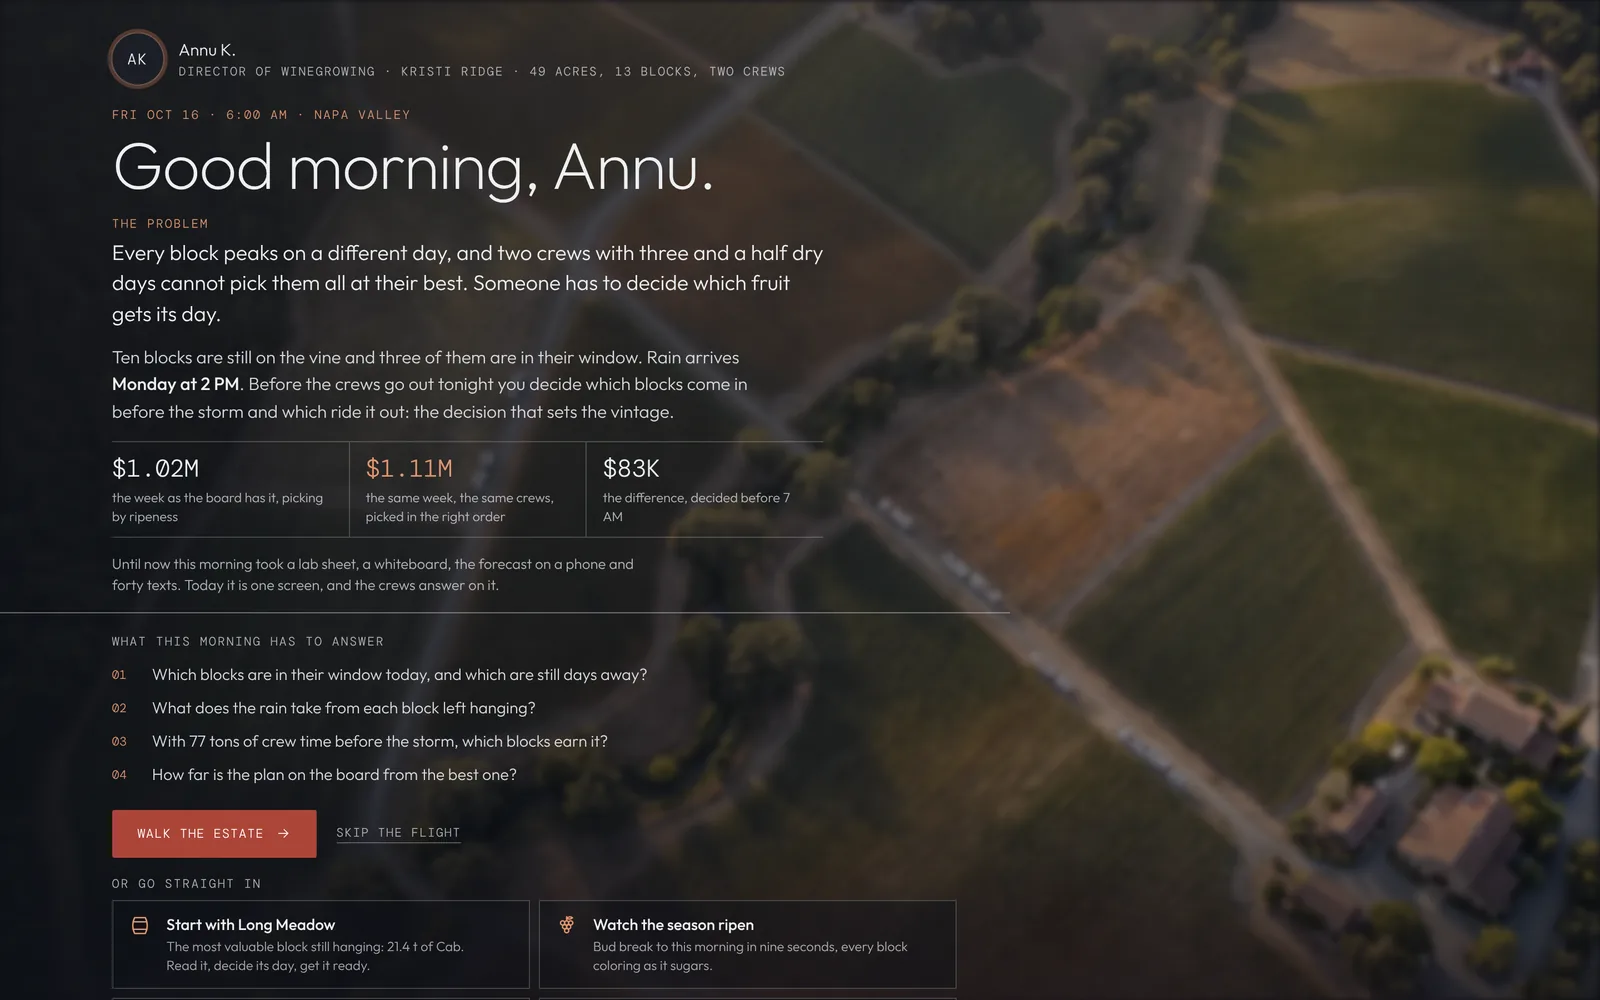
Kristi Ridge
A harvest planner for a vineyard. It shows which blocks are ready to pick before the rain, what each picking day is worth, and builds the week’s schedule for the crews.
The season in flight
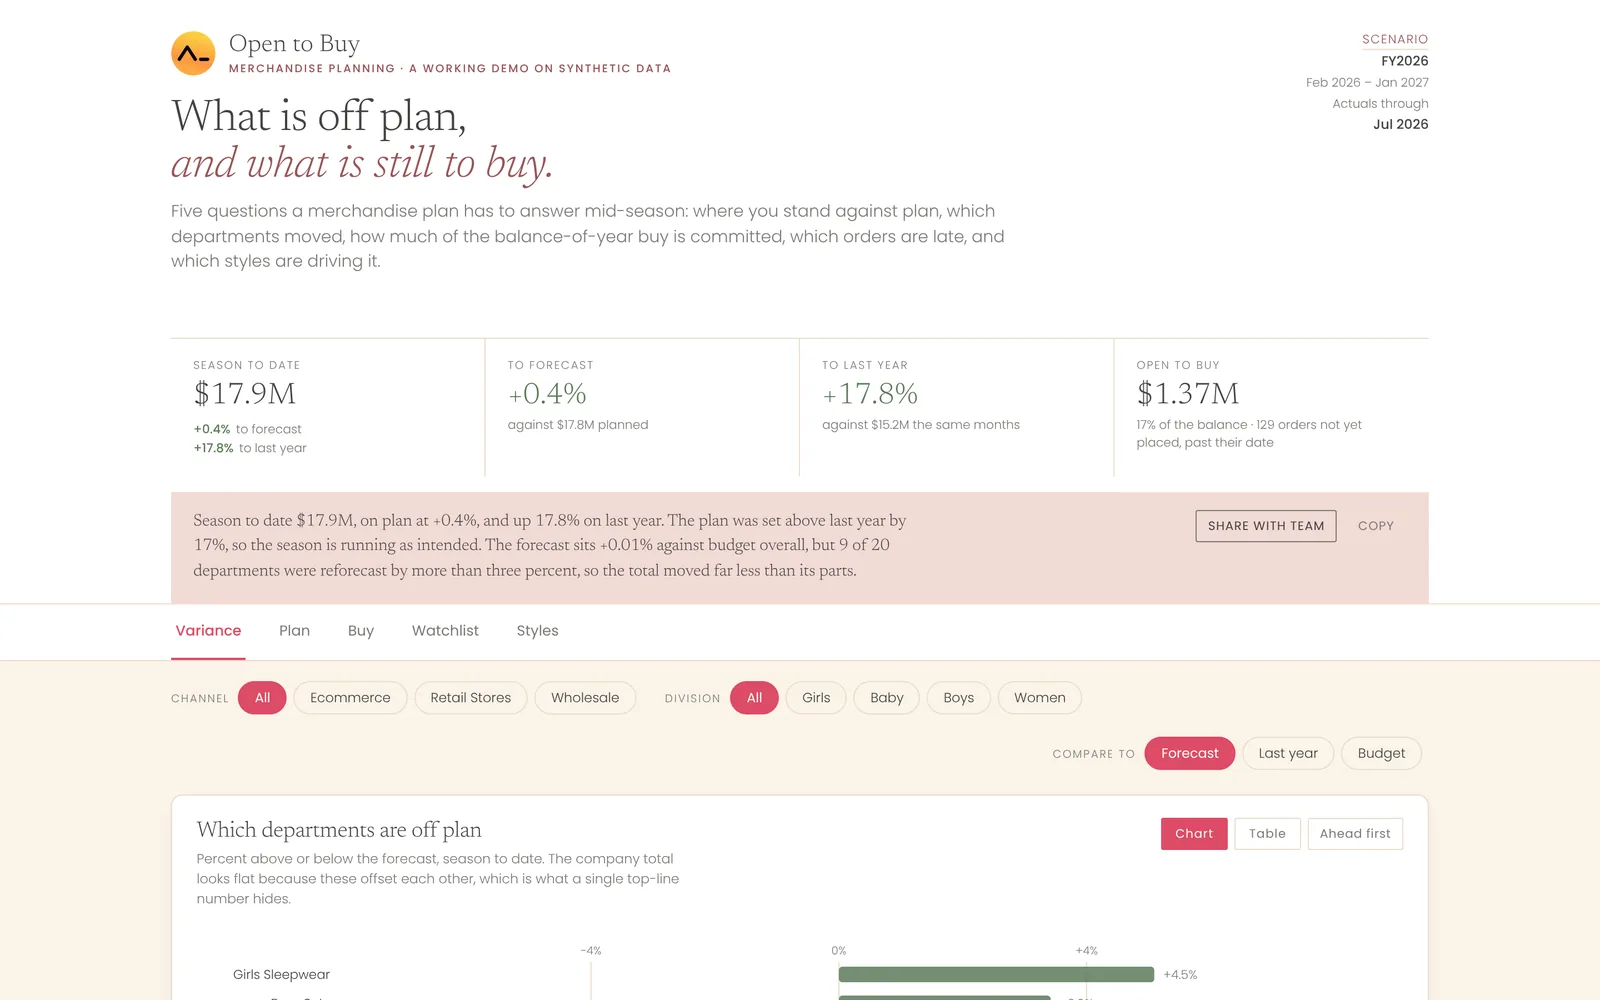
A merchandise planning app for an apparel buyer. It compares sales to forecast, budget and last year by department, and shows how much is left to buy.
Fifty seasons, one app
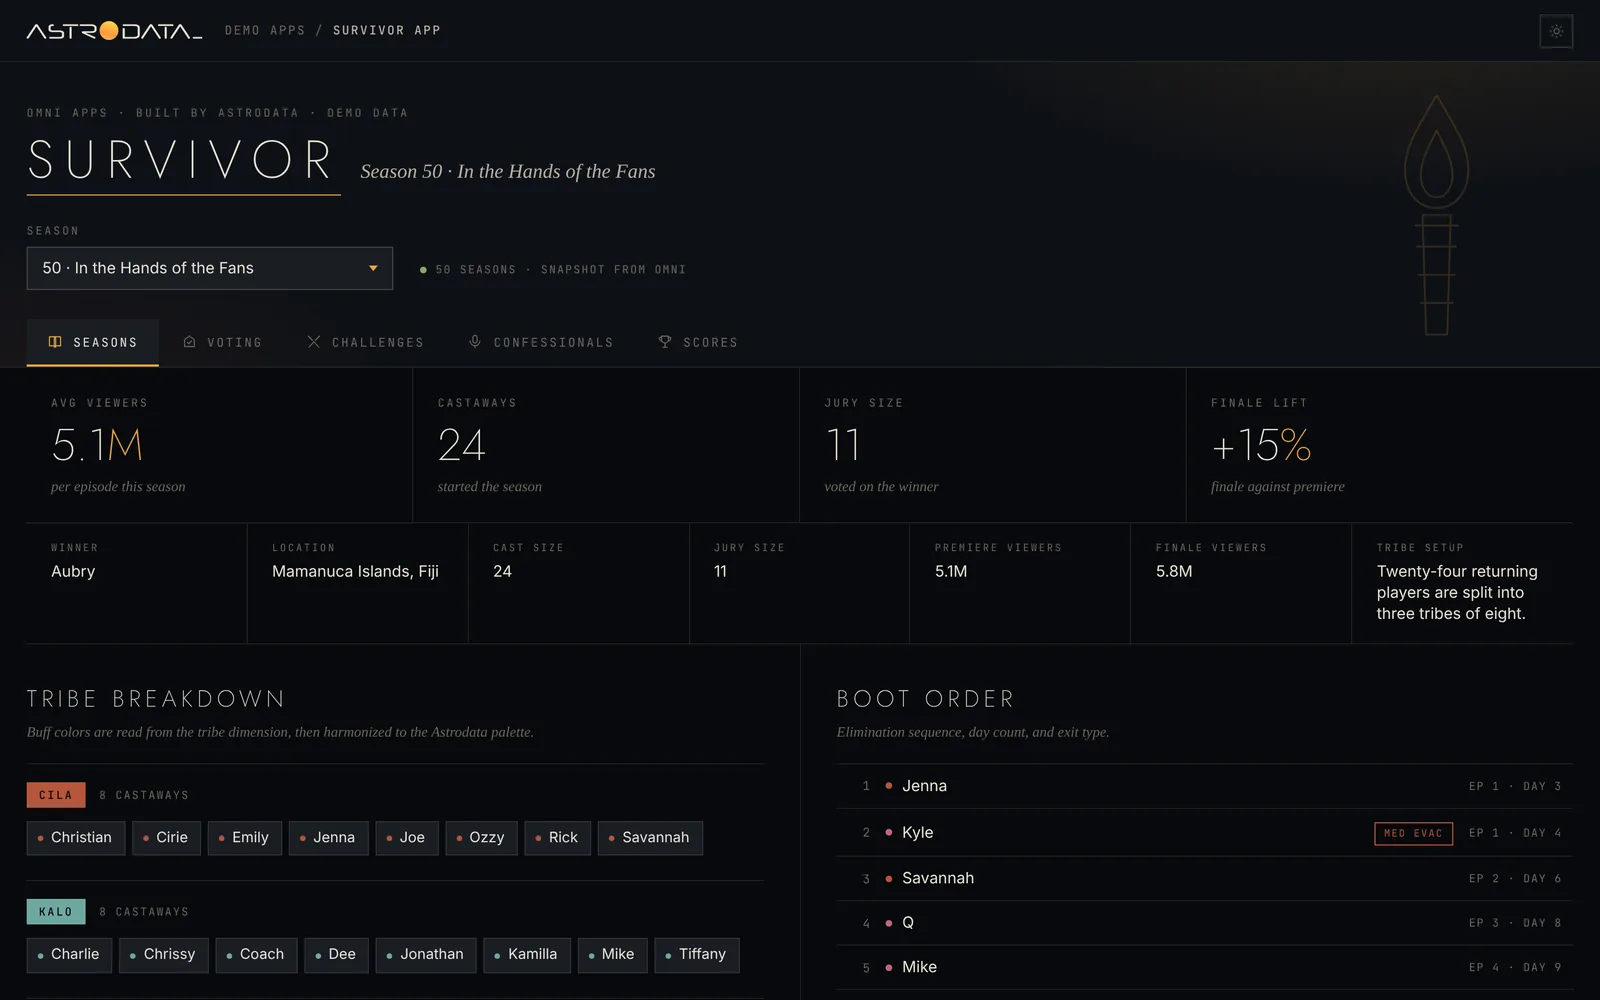
Every season of Survivor in one app. Look up boot order, tribal council votes, challenge results and screen time by season or by castaway.
World Cup 2018, 2022, 2026
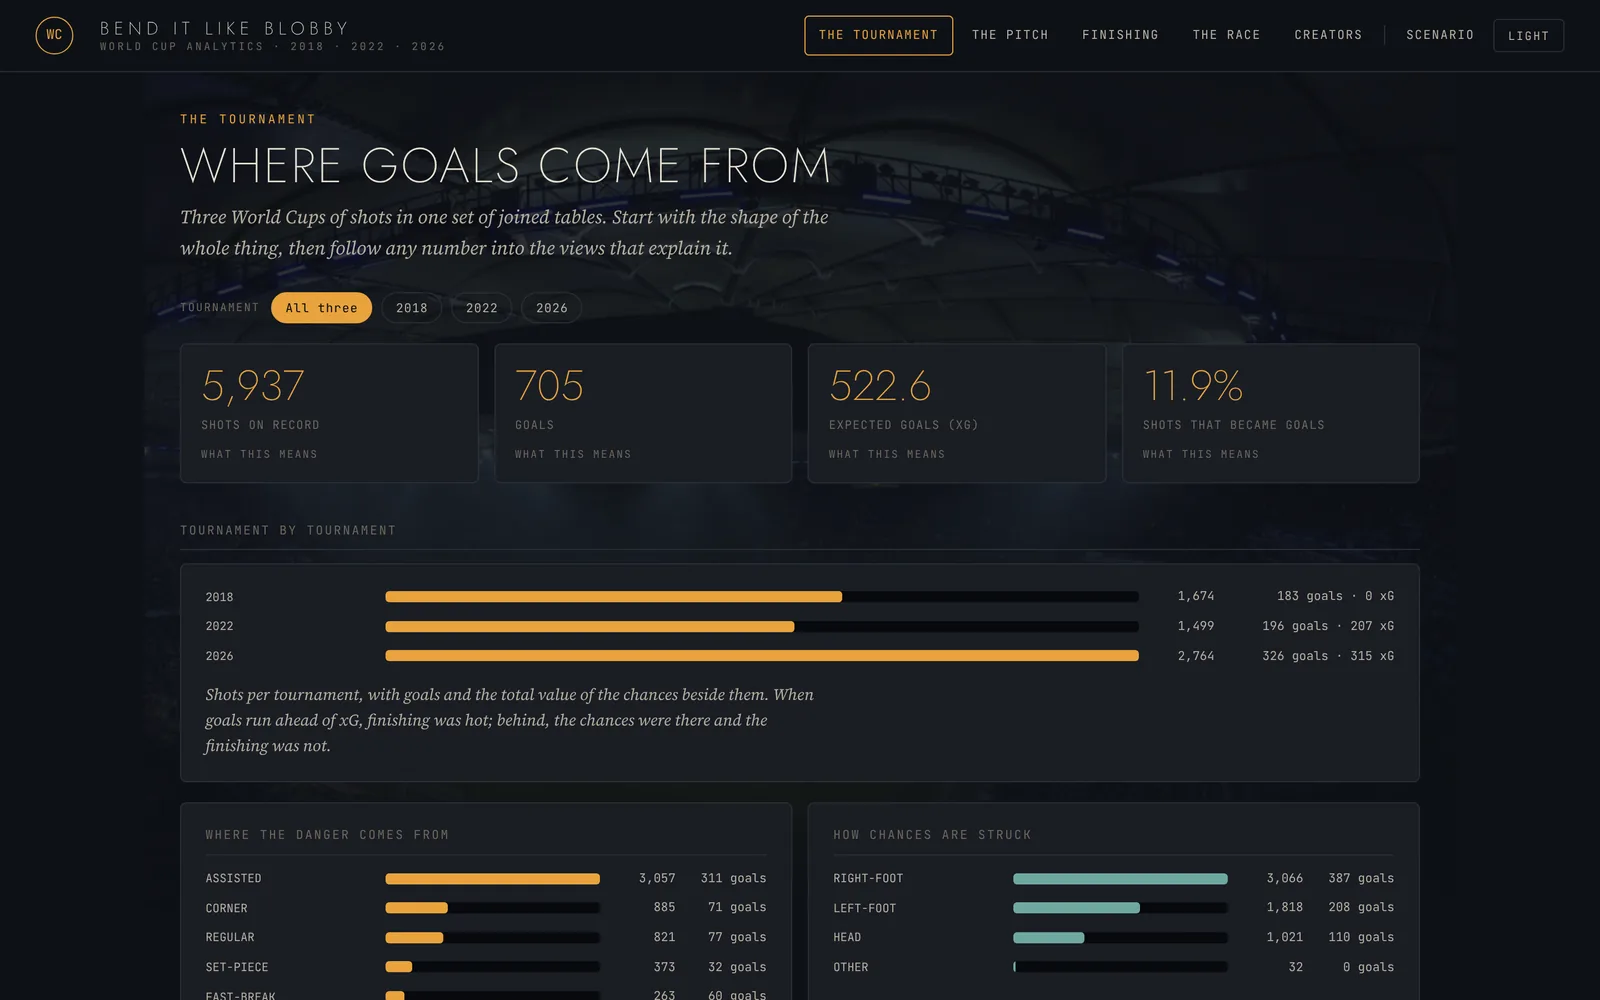
World Cup stats for 2018, 2022 and 2026. Compare shots, expected goals and finishing by team and by player.
Life-sciences segmentation
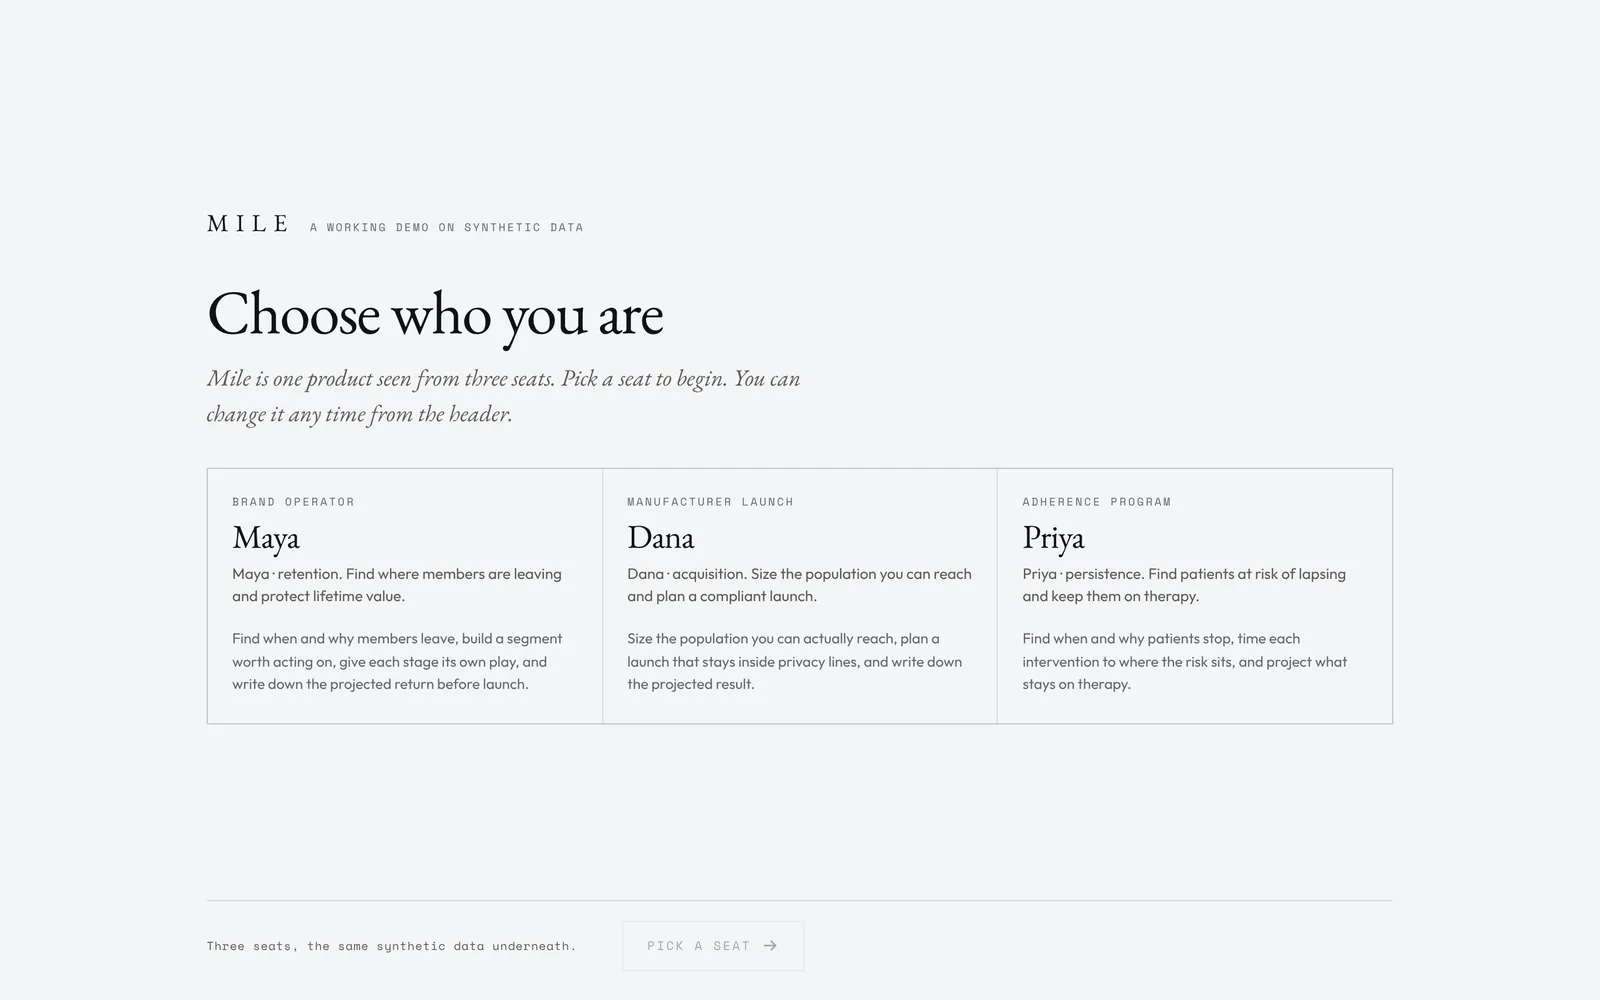
Audience segmentation for health brands. Build a segment, estimate a campaign’s reach and results, and track the campaign after launch.
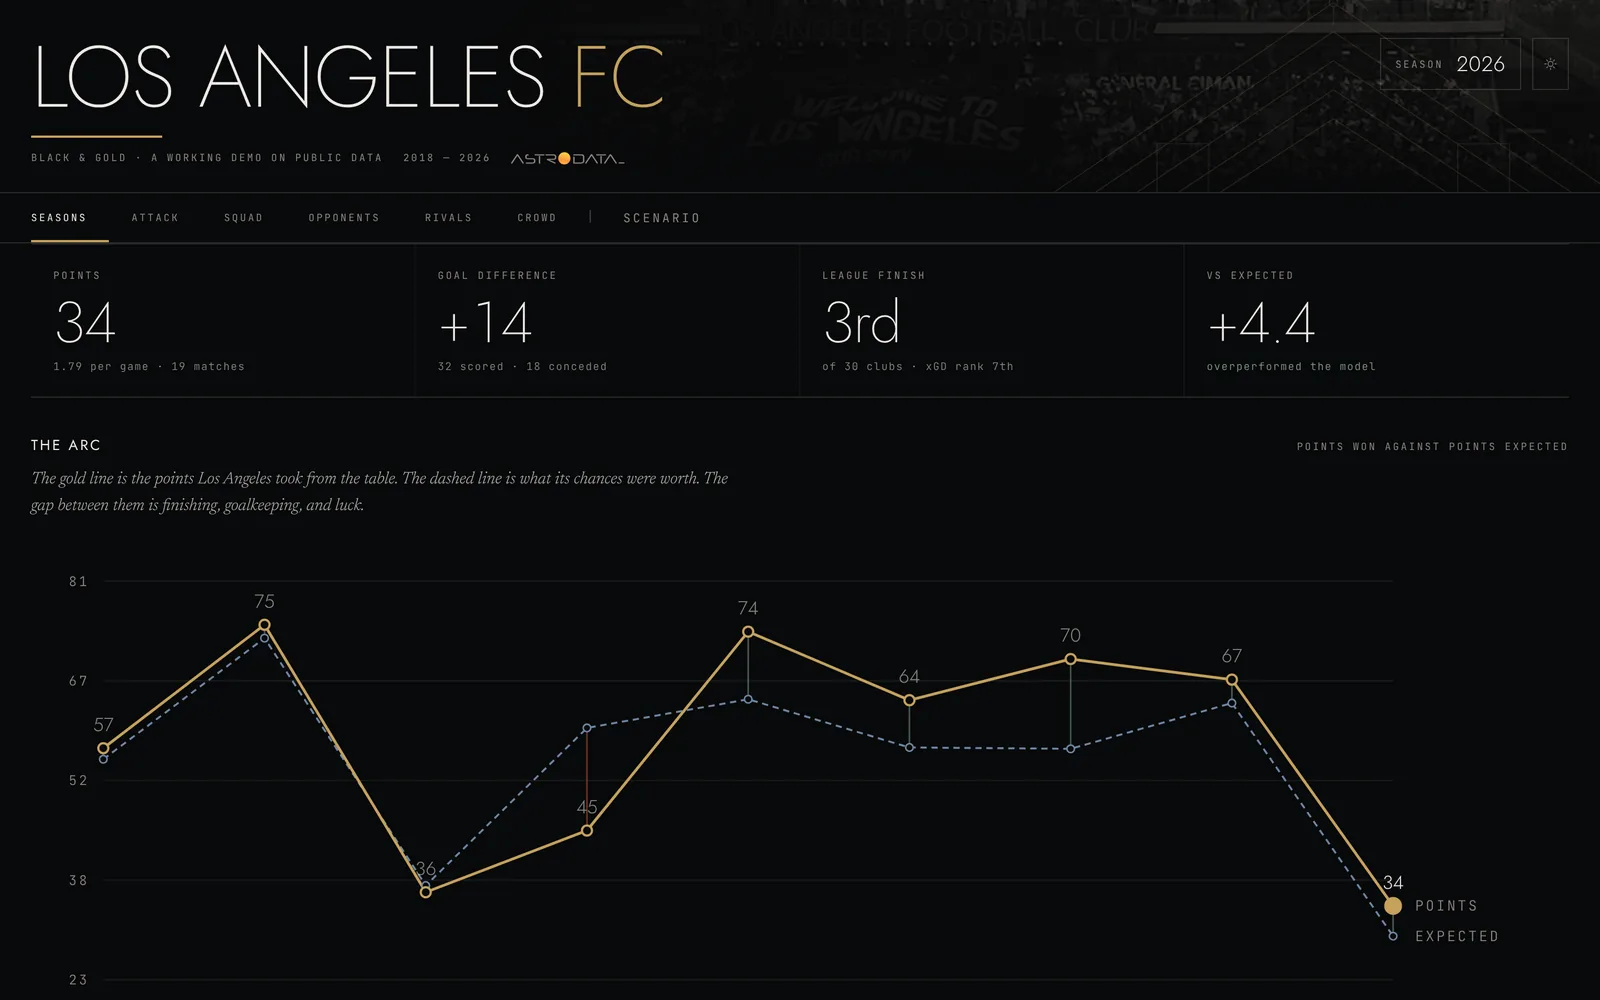
Black & Gold, nine seasons
Nine seasons of LAFC results. Compare points to expected points, see who scored and who created chances, and check the record against every opponent.
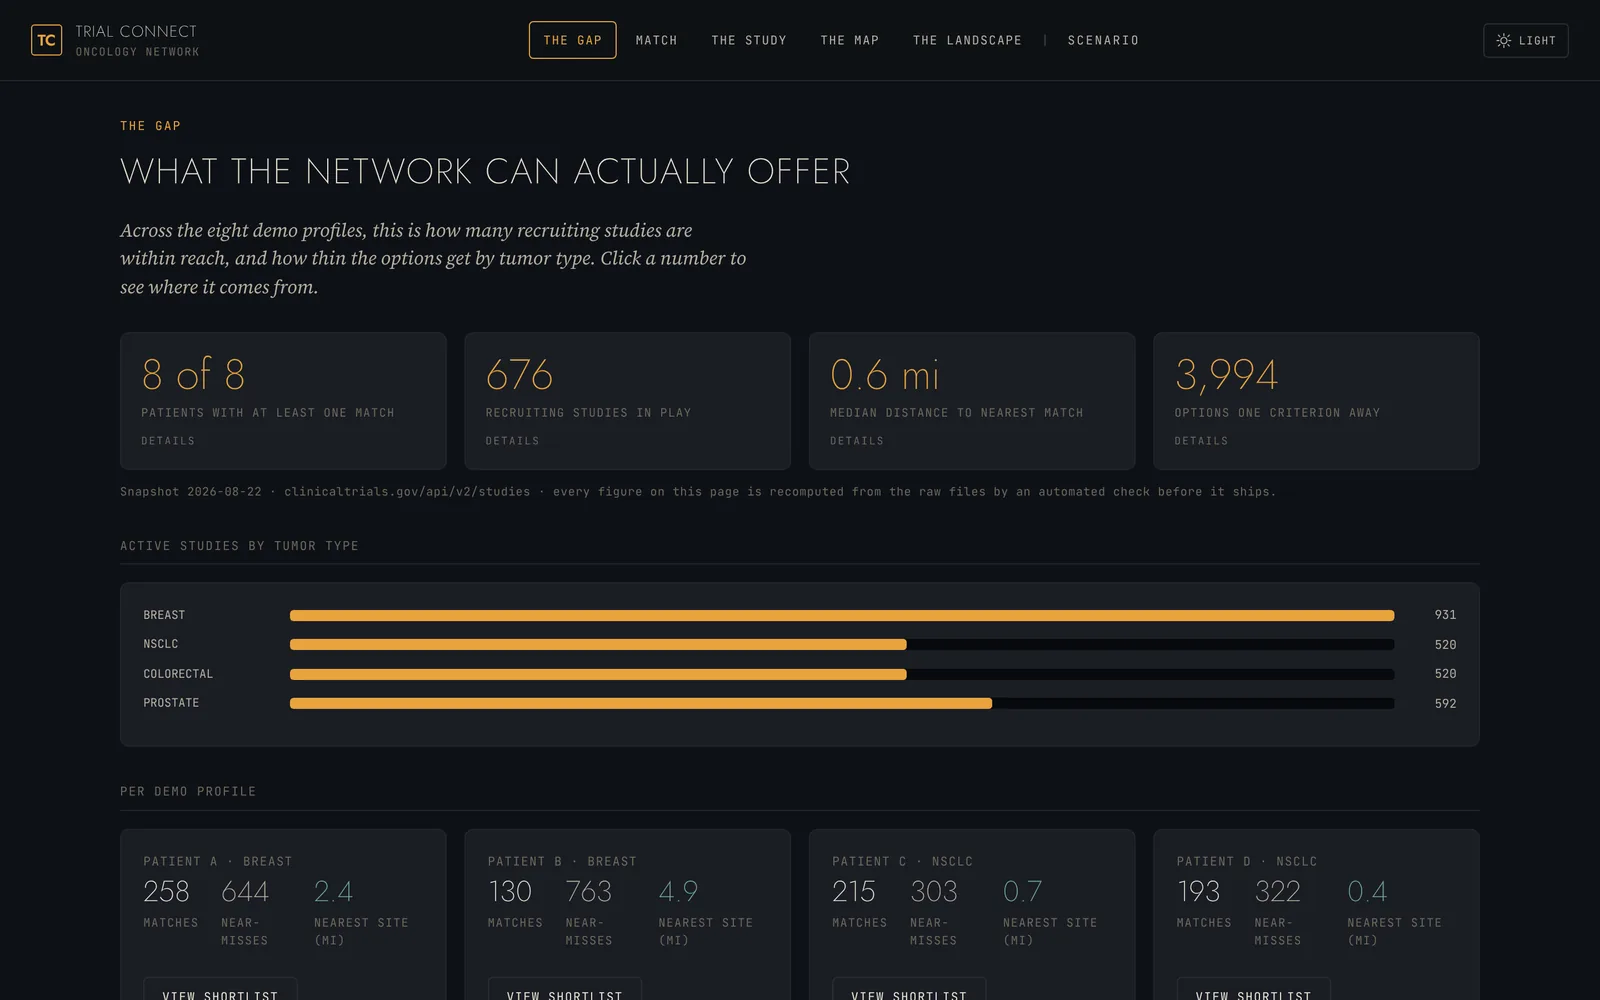
Clinical study connector
Matches patients to clinical trials that are recruiting. Enter de-identified patient details to get a shortlist, with the reason each trial matched.
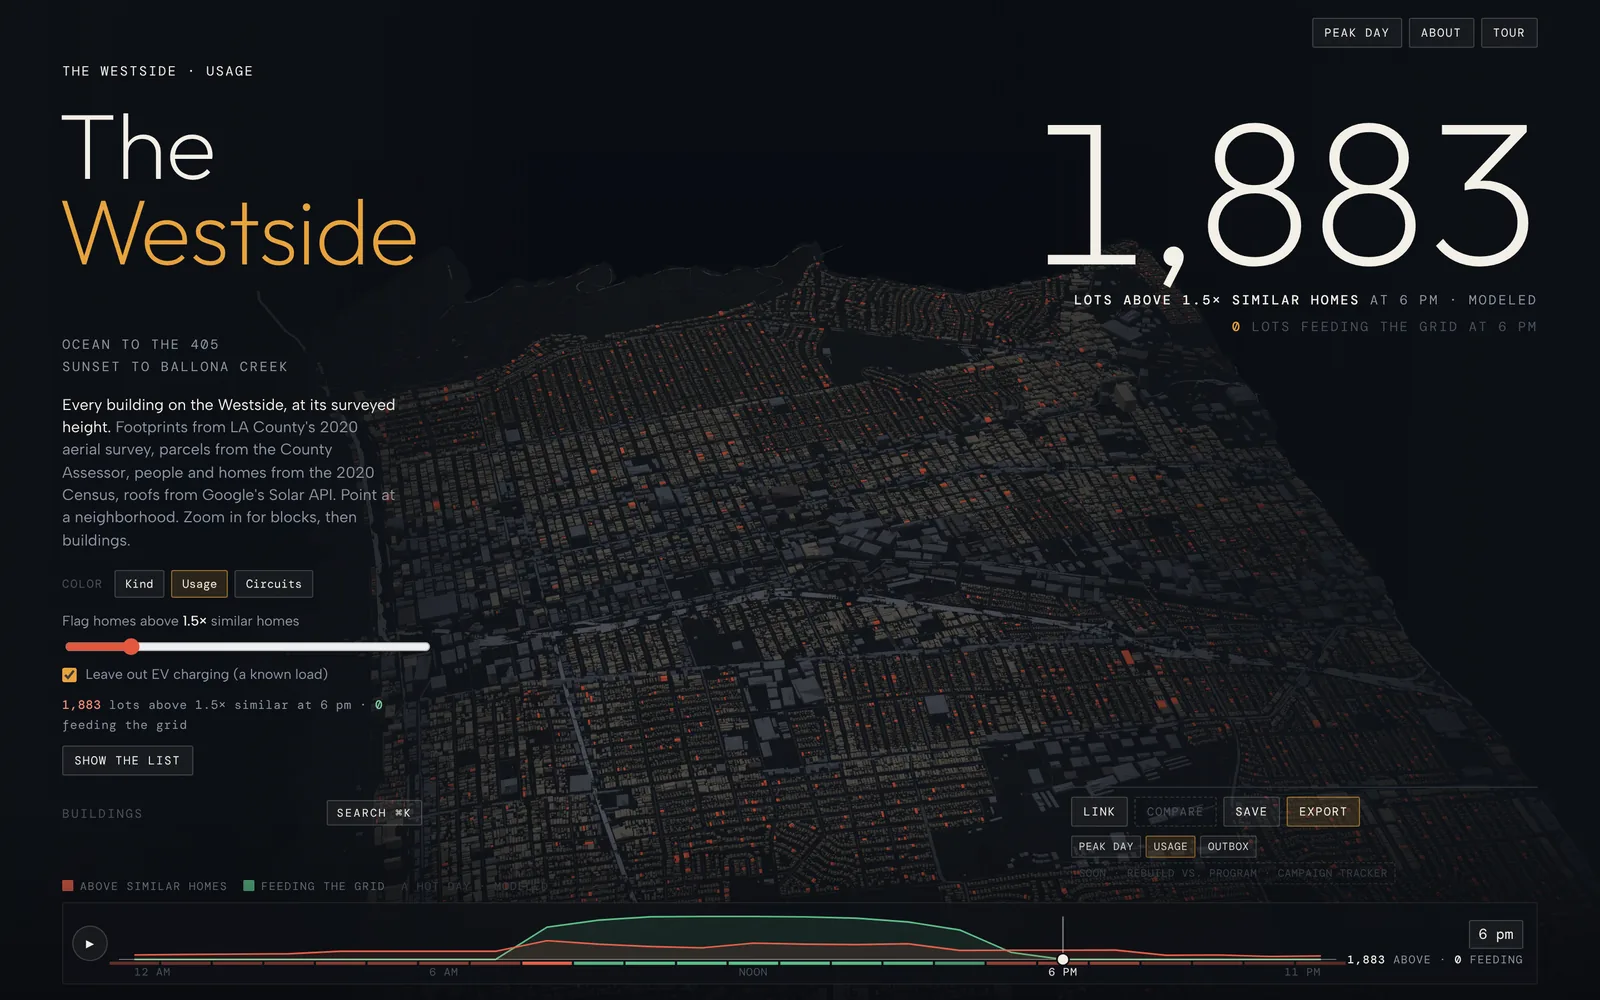
The Westside
A utility planner’s 3D map of the Westside of Los Angeles. See each building’s modeled energy use, play out a peak-demand evening, and open an energy report for any home.
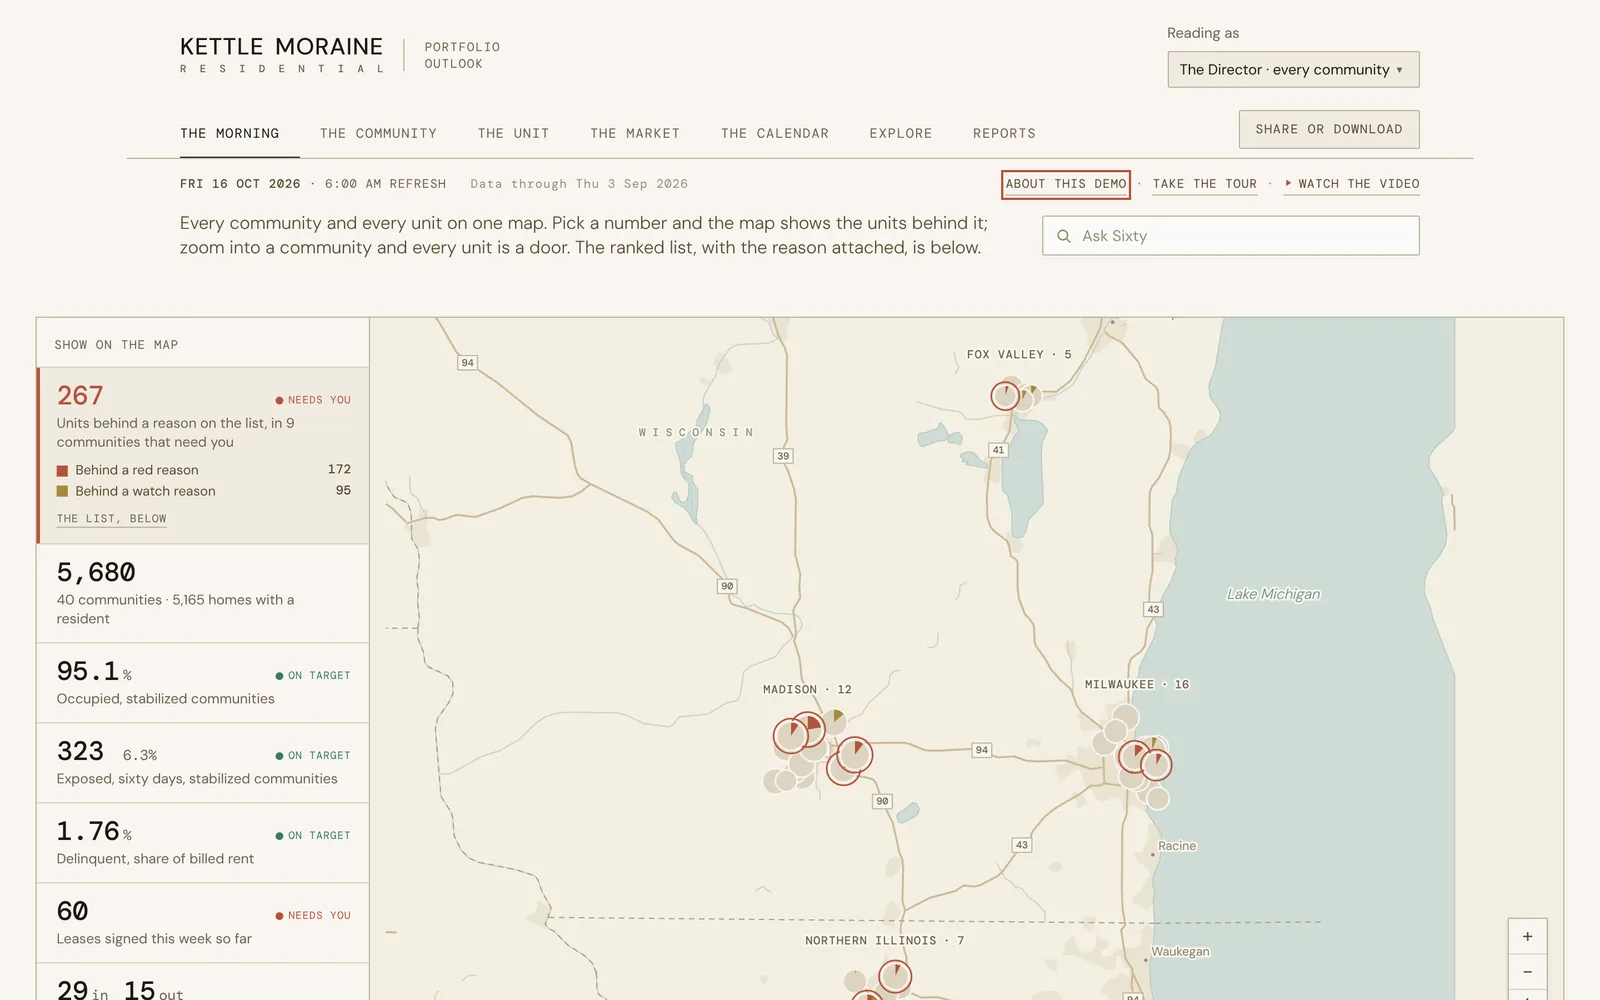
Kettle Moraine Residential
An operations view of 40 apartment communities. It ranks what needs attention in the next 60 days and drills down to a single unit and lease.
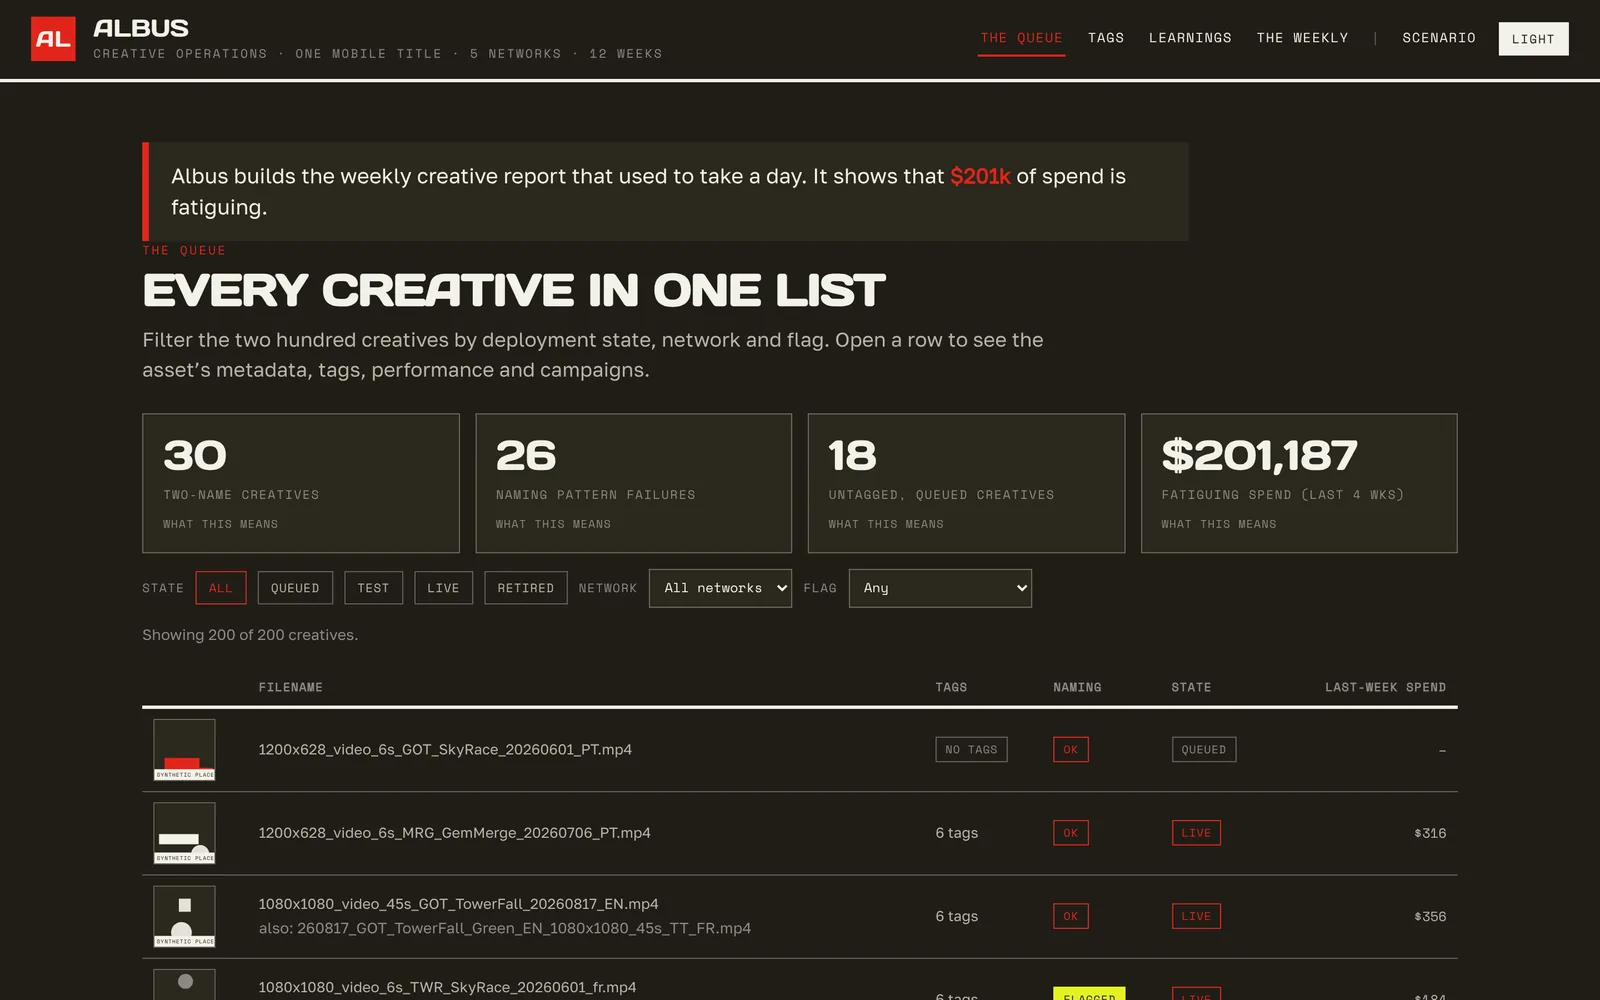
Creative operations
Builds the weekly creative performance report automatically. Every ad is tracked with its tags, where it is running and how it is performing.
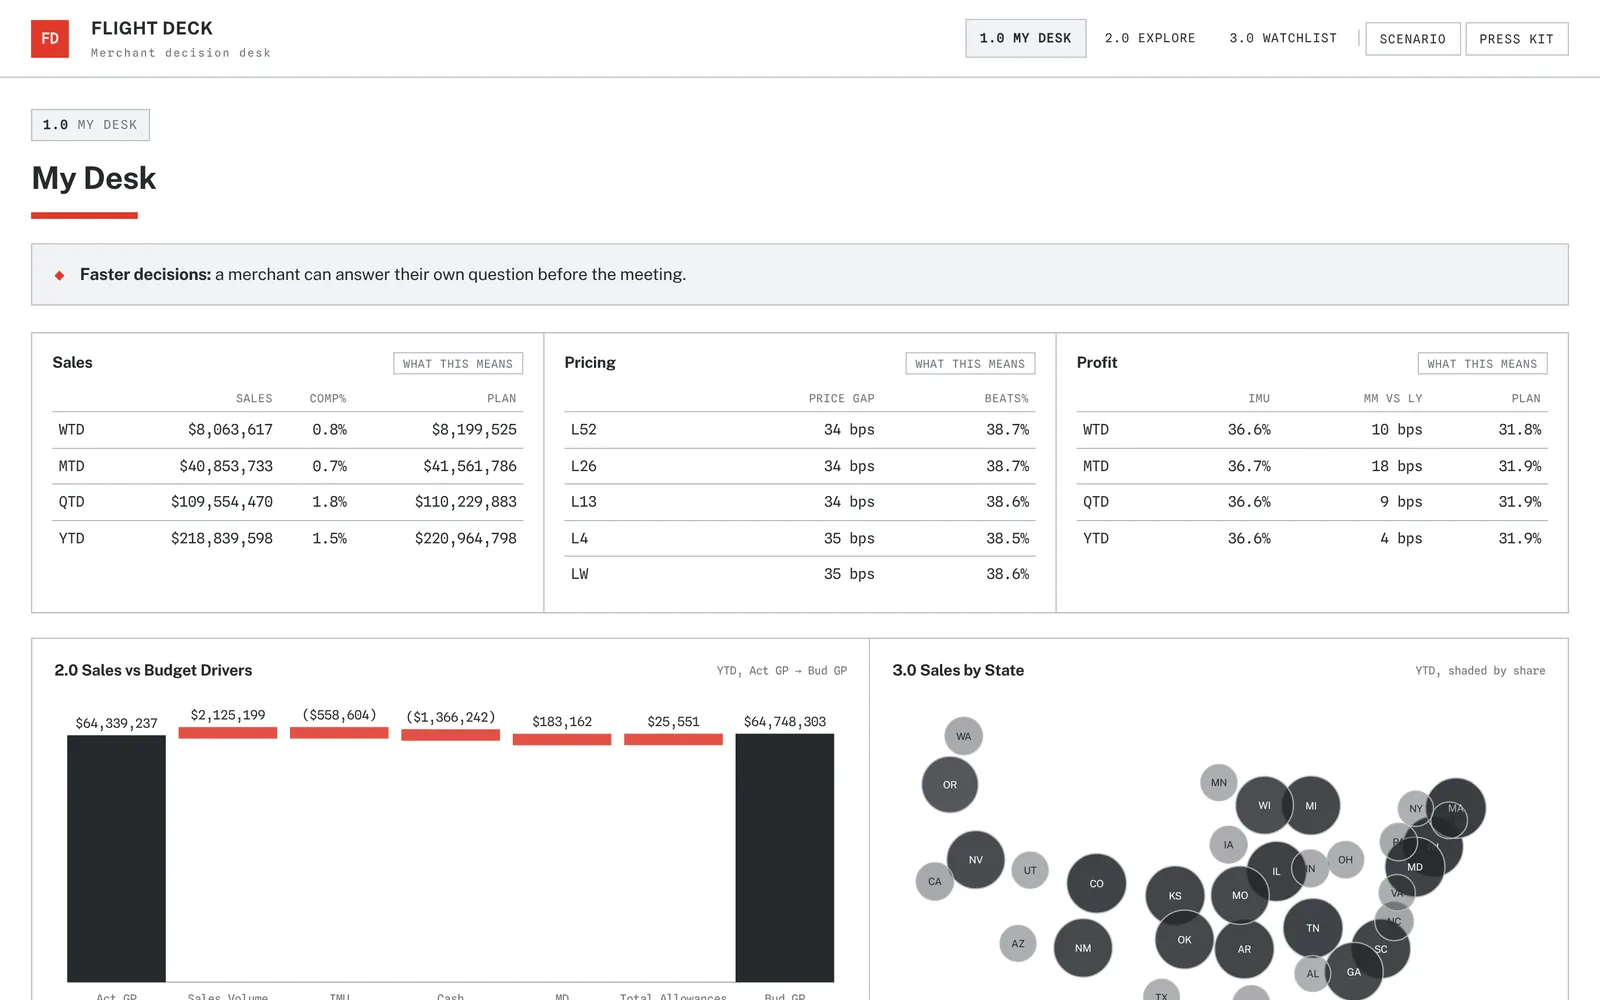
Merchant decision desk
A dashboard for retail merchants covering sales, pricing and margin. Build your own breakdowns and keep a watchlist that flags what changed.
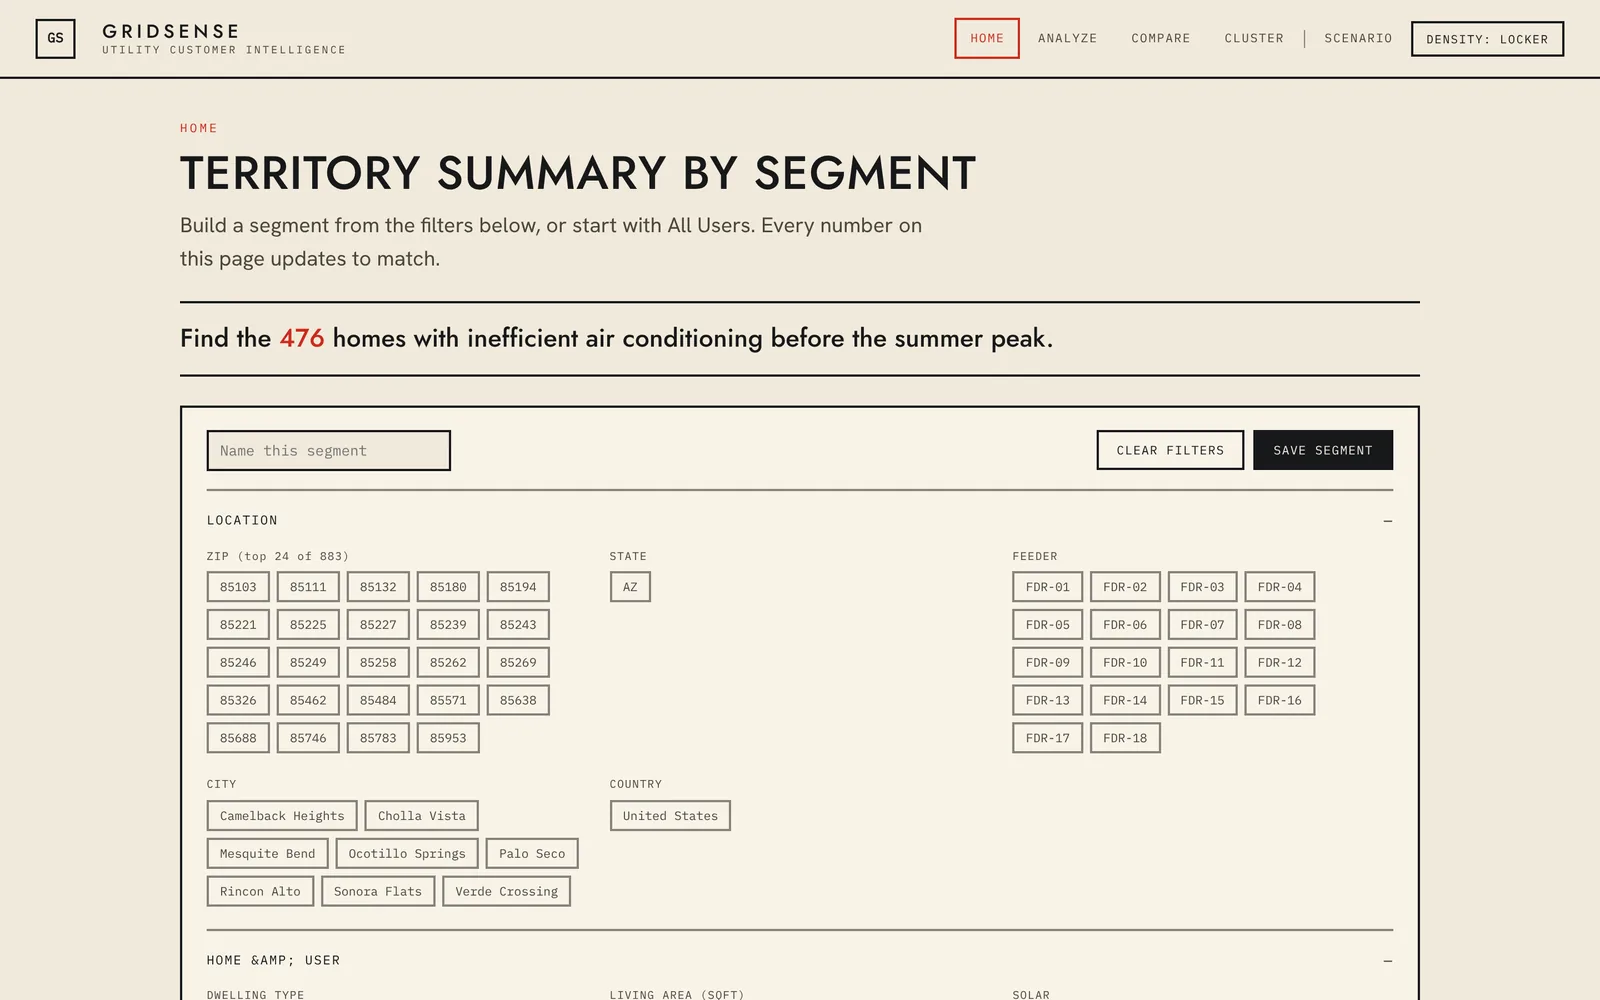
Utility customer intelligence
Builds lists of utility customers for energy programs. Filter homes by usage and equipment, for example homes whose air conditioning drives up summer peak demand.
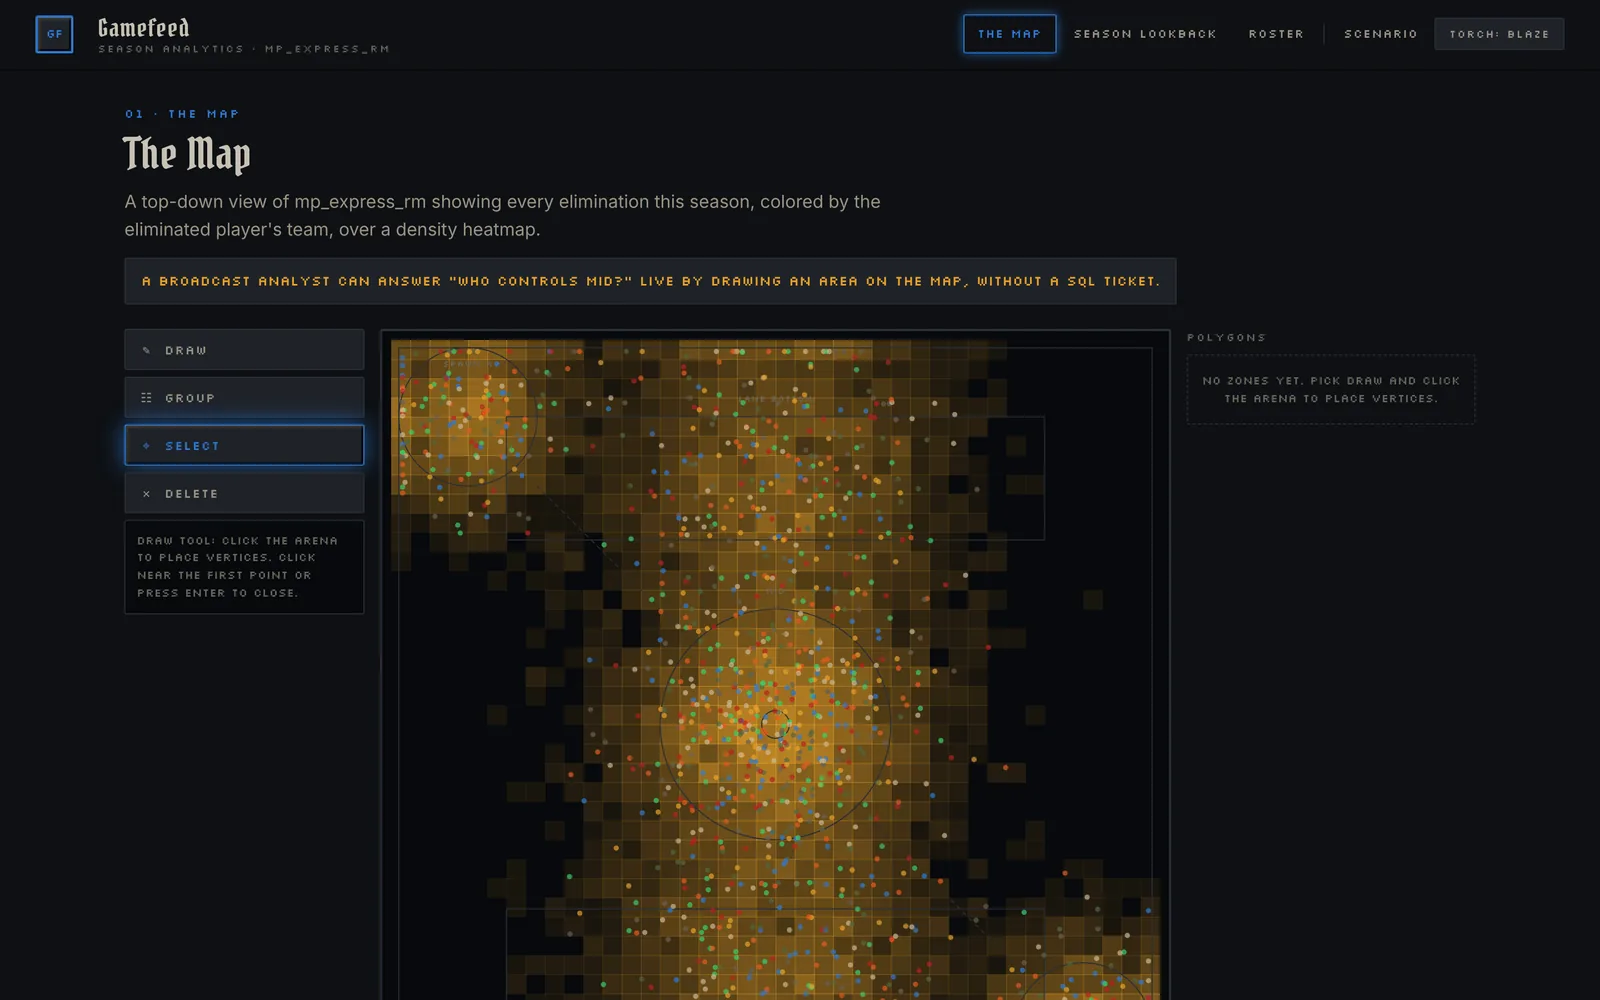
Match analytics
Match analytics for a competitive shooter. Draw an area on the map and every stat on the page updates to show what happened there.
Underneath the apps
Astrodata is a data and AI consultancy. Most of our work is the part nobody sees: platforms, pipelines, models and metric definitions for teams that need their numbers to hold up. These apps put that work in front of you, on a single screen.
01
We build and run data platforms on Snowflake, BigQuery and Databricks, and we are a Snowflake Premier partner. The data behind an app lands, refreshes and gets checked the same way it does on a client platform.
02
Every metric is defined once in dbt and tested before it reaches a screen. For Clever, we brought their metric definitions together in dbt on Snowflake and handed over a reporting suite their team runs on its own.
03
The app, the dashboards and the AI assistant all read the same definitions in Omni, so they agree. For WorkRamp, we rebuilt their customer-facing analytics on Omni in under three months, with no disruption to their customers.
04
We design for the person who has to act on the number, usually not an analyst. The number, the reason behind it and the next step sit together, and every figure can be traced back to its rows.
Teams we build for
Read the case studies





How they get built
A team will live with a number it can’t explain. A customer won’t. So every app follows the same shape: a decision worth making, data shaped and tested for that decision, and a screen that puts the number, its reason and the next step together.
01
What does the buyer, the planner, the operator decide this week, and what would they need to see to decide it well? That question sets the scope.
02
Modeled once, defined once, tested before it reaches the screen. Seeded synthetic data where a client set does not exist yet, public data where it does, and every total the sum of the rows beneath it.
03
Built as an Omni App on the Omni semantic layer, with a public static build alongside for anyone to open. The same product, two front doors.