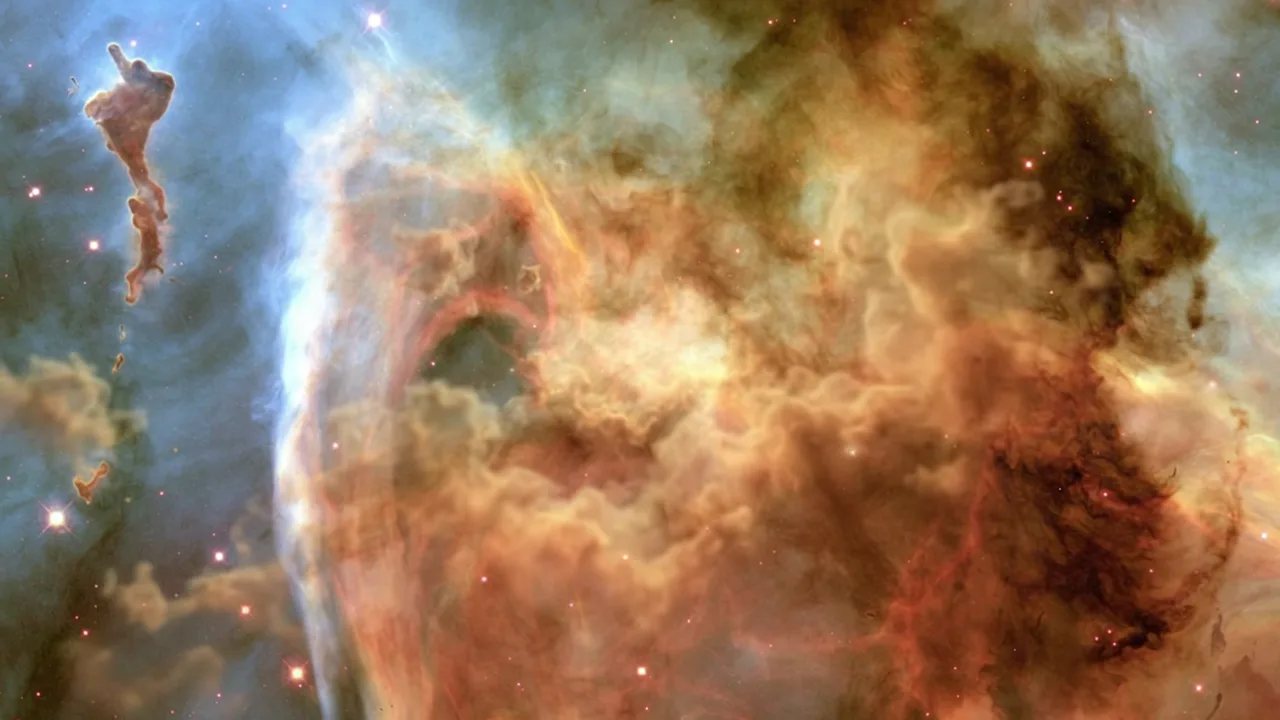
Glowing clouds of gas and dust in the Carina Nebula

Looker Data Apps · Built by Astrodata

Our apps, running inside Looker

Looker added Data Apps in October 2026: custom applications that live inside Looker and read from your LookML models. We rebuilt six of our apps on it the week it launched. The screens are new to Looker. The work under them is what Astrodata does for clients every day: data platforms, dbt models and metric definitions that hold up when someone checks them.

All apps

Pick a sector, open an app

Tell us who you are once and every app opens. Most have a public build anyone can open. Every Looker edition runs on the Astrodata Looker instance, so ask us for a walkthrough.

  • Sensoco opening screen
    LogisticsLooker sign-in

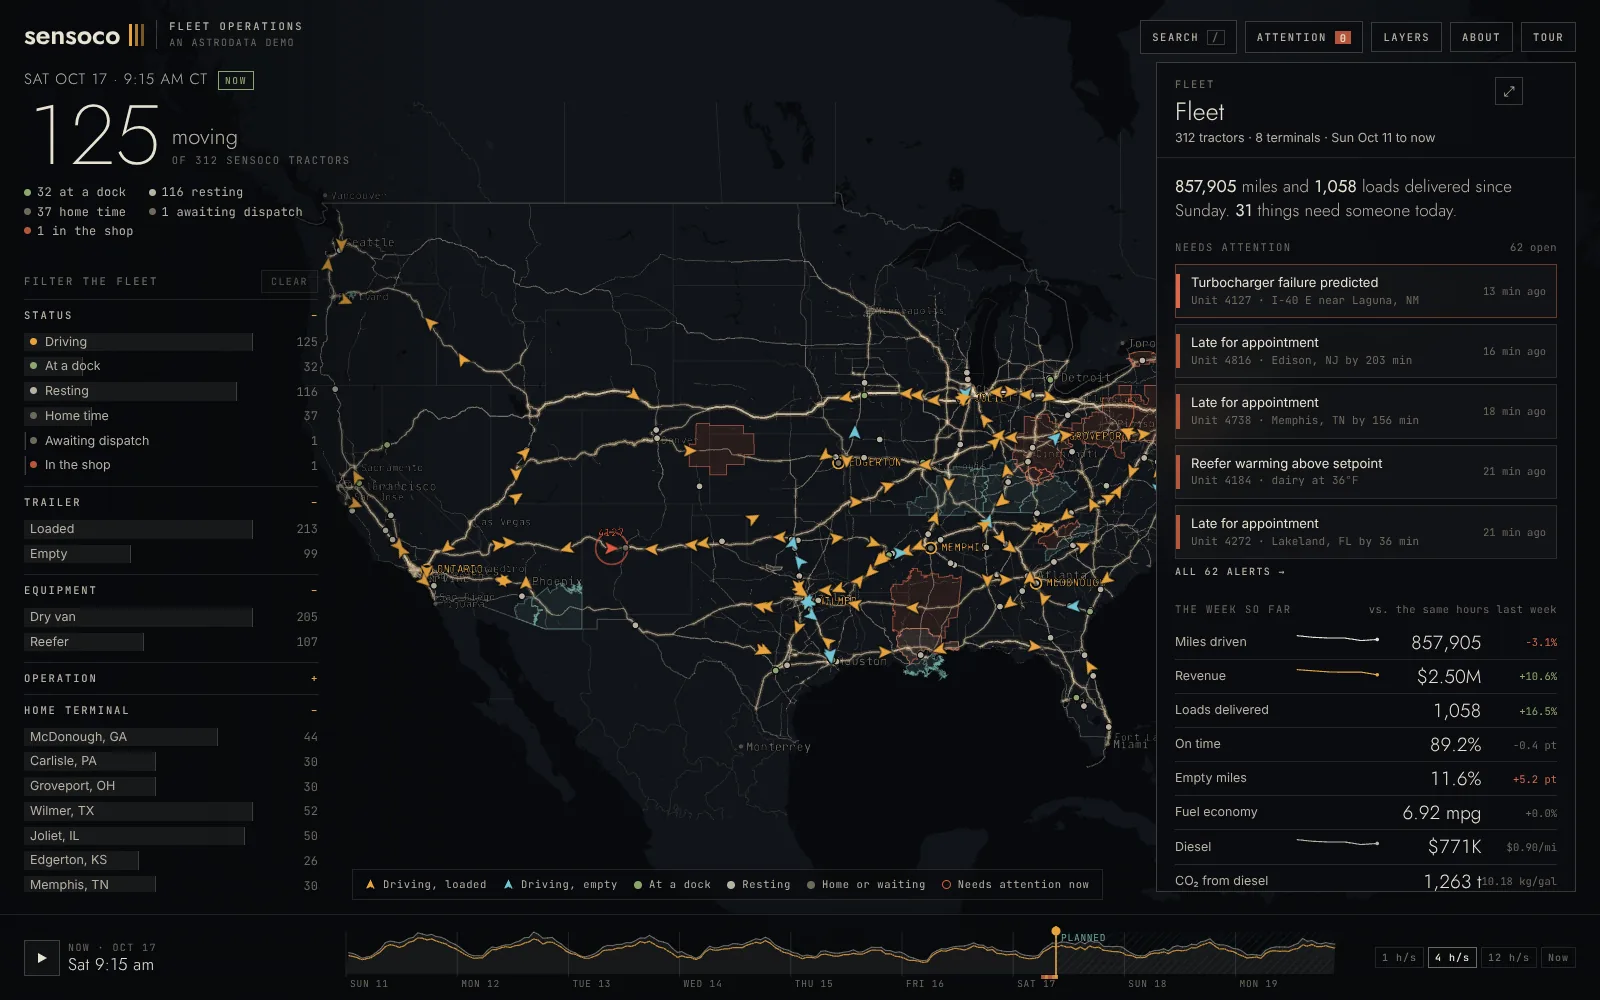
    Sensoco

    Fleet operations

    A national trucking fleet on one live map: 312 tractors on the real U.S. freight network. See which truck is about to break down, which loads will run late and where the weather is, then plan the fix.

    • Live public data
    • 1 LookML explore
    • 312 tractors
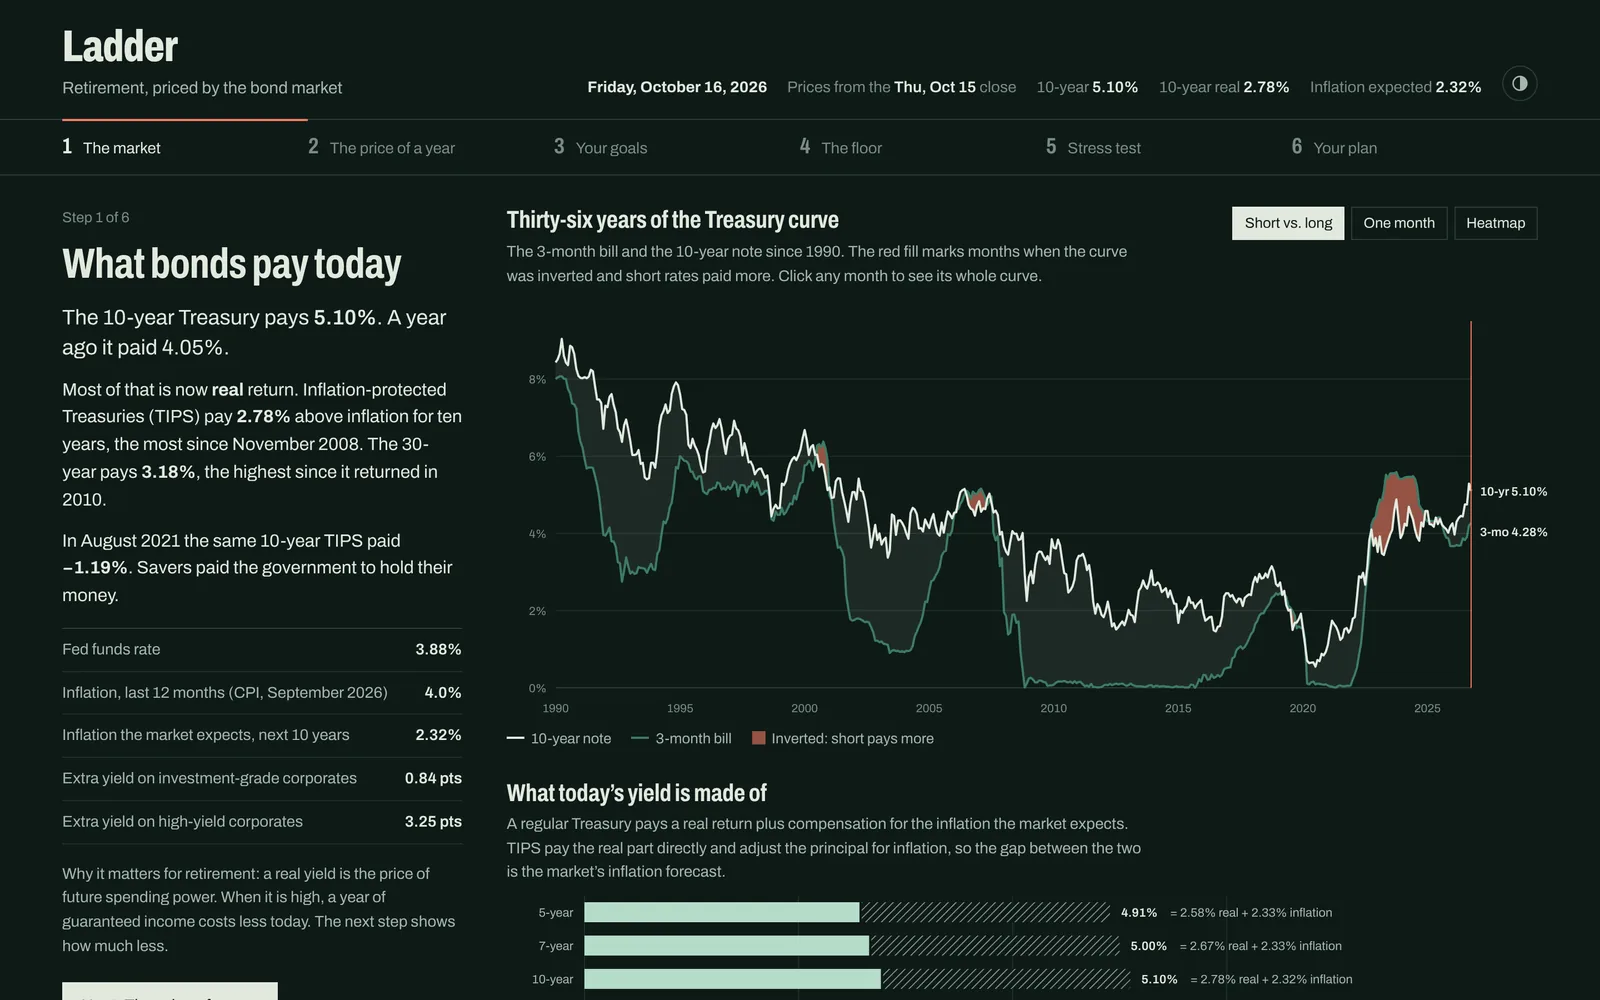
  • Ladder opening screen
    Finance

    Ladder

    Retirement, priced by the bond market

    A retirement planner built on current Treasury and TIPS rates. Enter your goals and it shows how much guaranteed income you can lock in, and how the plan would have held up in every year since 1928.

    • Live public data
    • 5 LookML explores
    • Treasury and TIPS rates
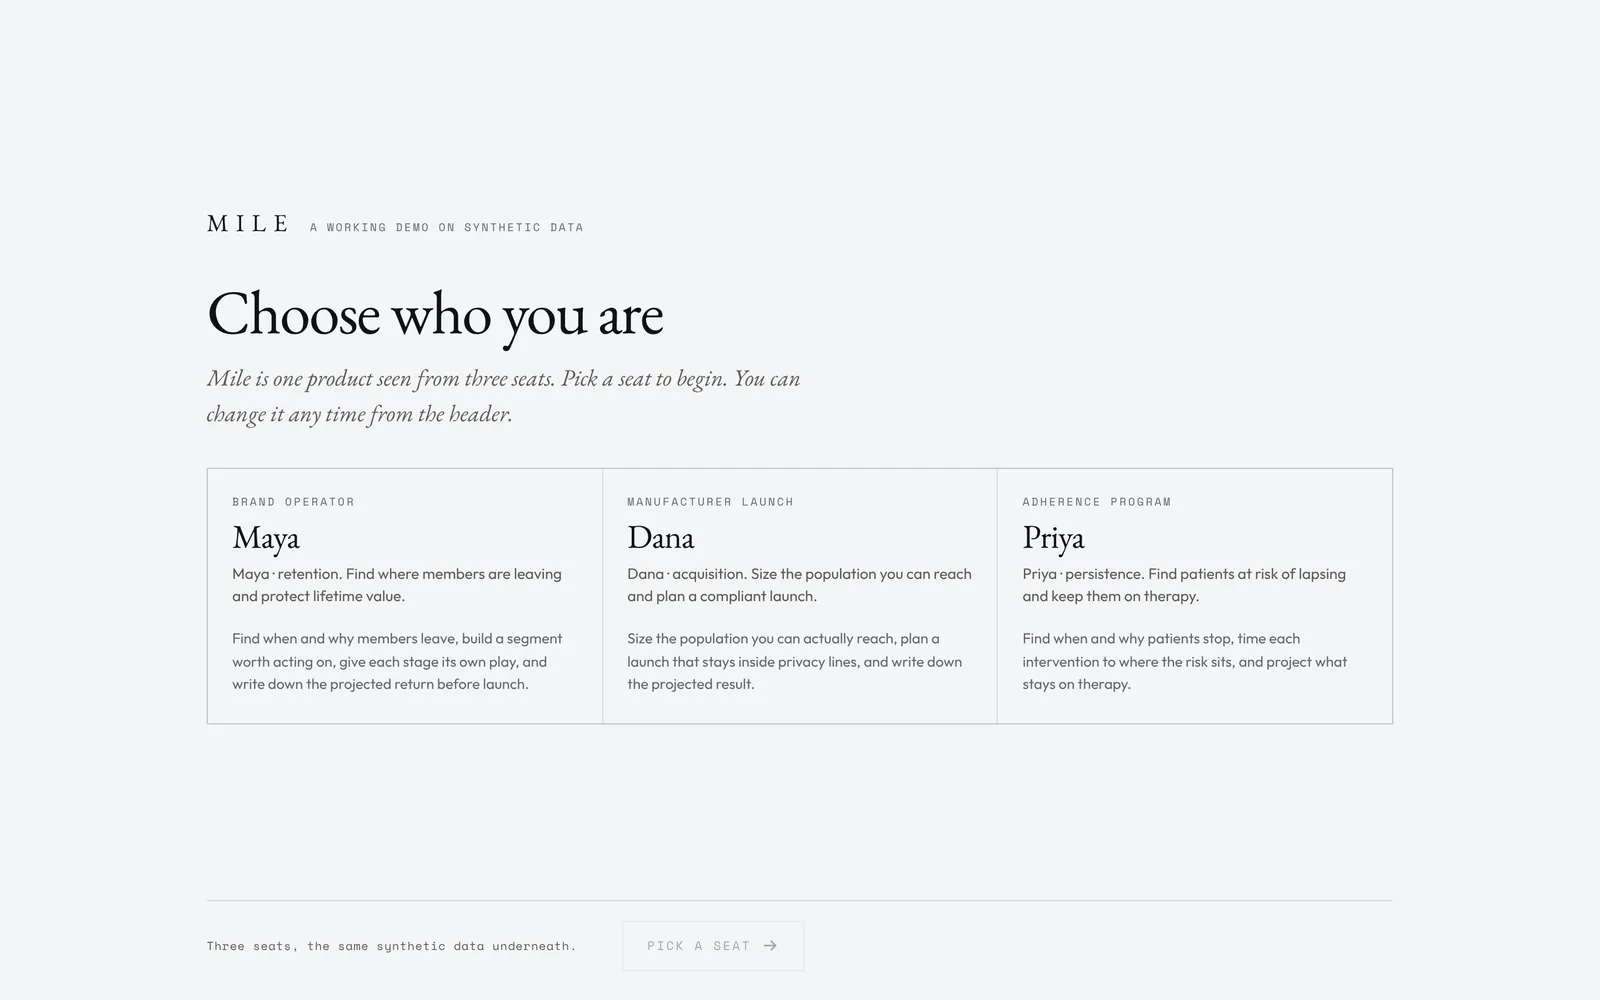
  • Mile opening screen
    Life sciences

    Mile

    Life-sciences segmentation

    Audience segmentation for health brands. Build a segment, estimate a campaign’s reach and results, and track the campaign after launch.

    • Synthetic data
    • 19 LookML explores
    • Segment builder
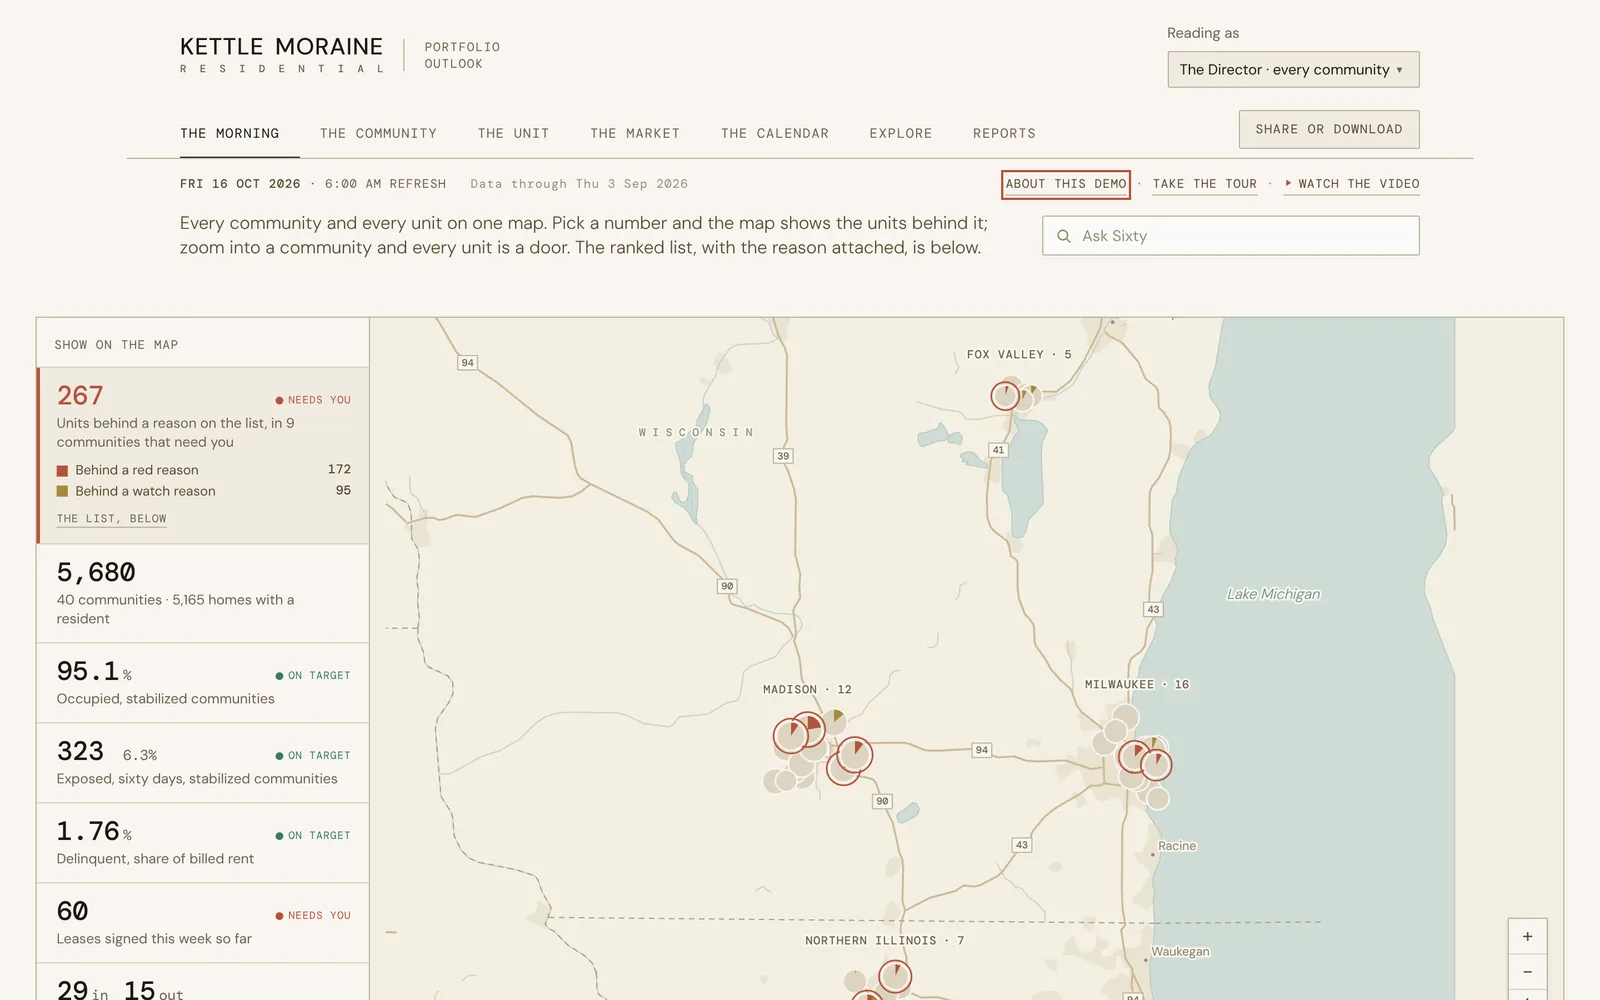
  • Sixty opening screen
    Real estate

    Sixty

    Kettle Moraine Residential

    An operations view of 40 apartment communities. It ranks what needs attention in the next 60 days and drills down to a single unit and lease.

    • Synthetic data
    • 11 LookML explores
    • 73,000 rows
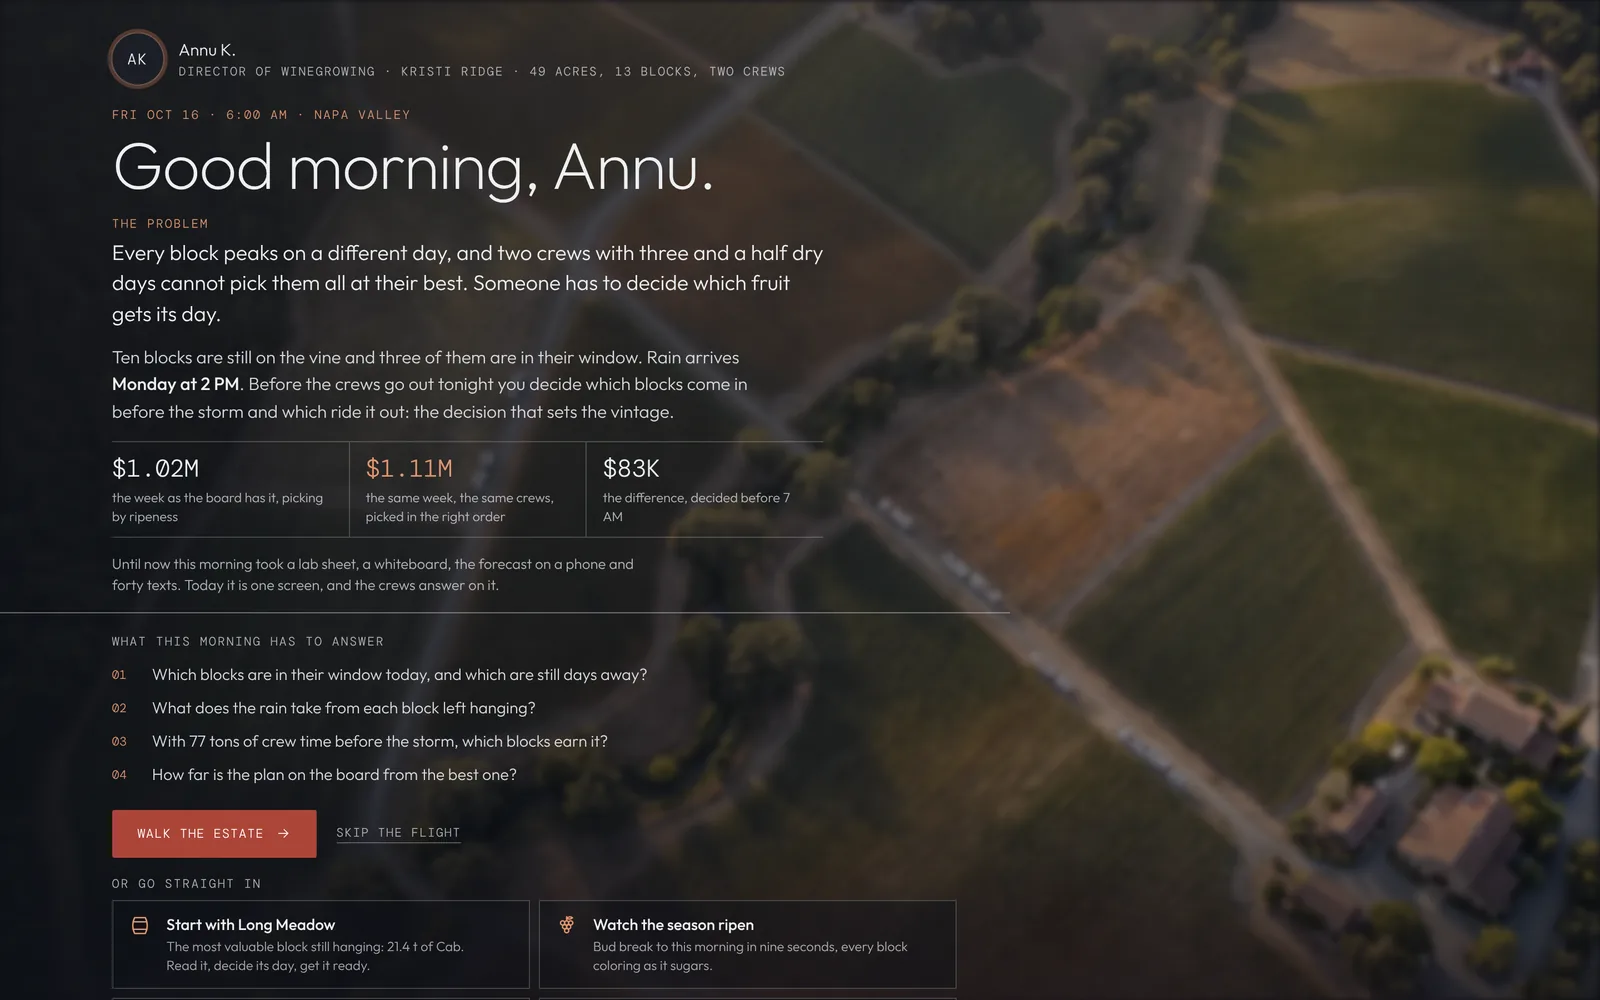
  • Harvest opening screen
    Agriculture

    Harvest

    Kristi Ridge

    A harvest planner for a vineyard. It shows which blocks are ready to pick before the rain, what each picking day is worth, and builds the week’s schedule for the crews.

    • Synthetic data
    • 5 LookML explores
    • Vineyard map
  • Pacific Basin Electric opening screen
    UtilitiesLooker sign-in

    Pacific Basin Electric

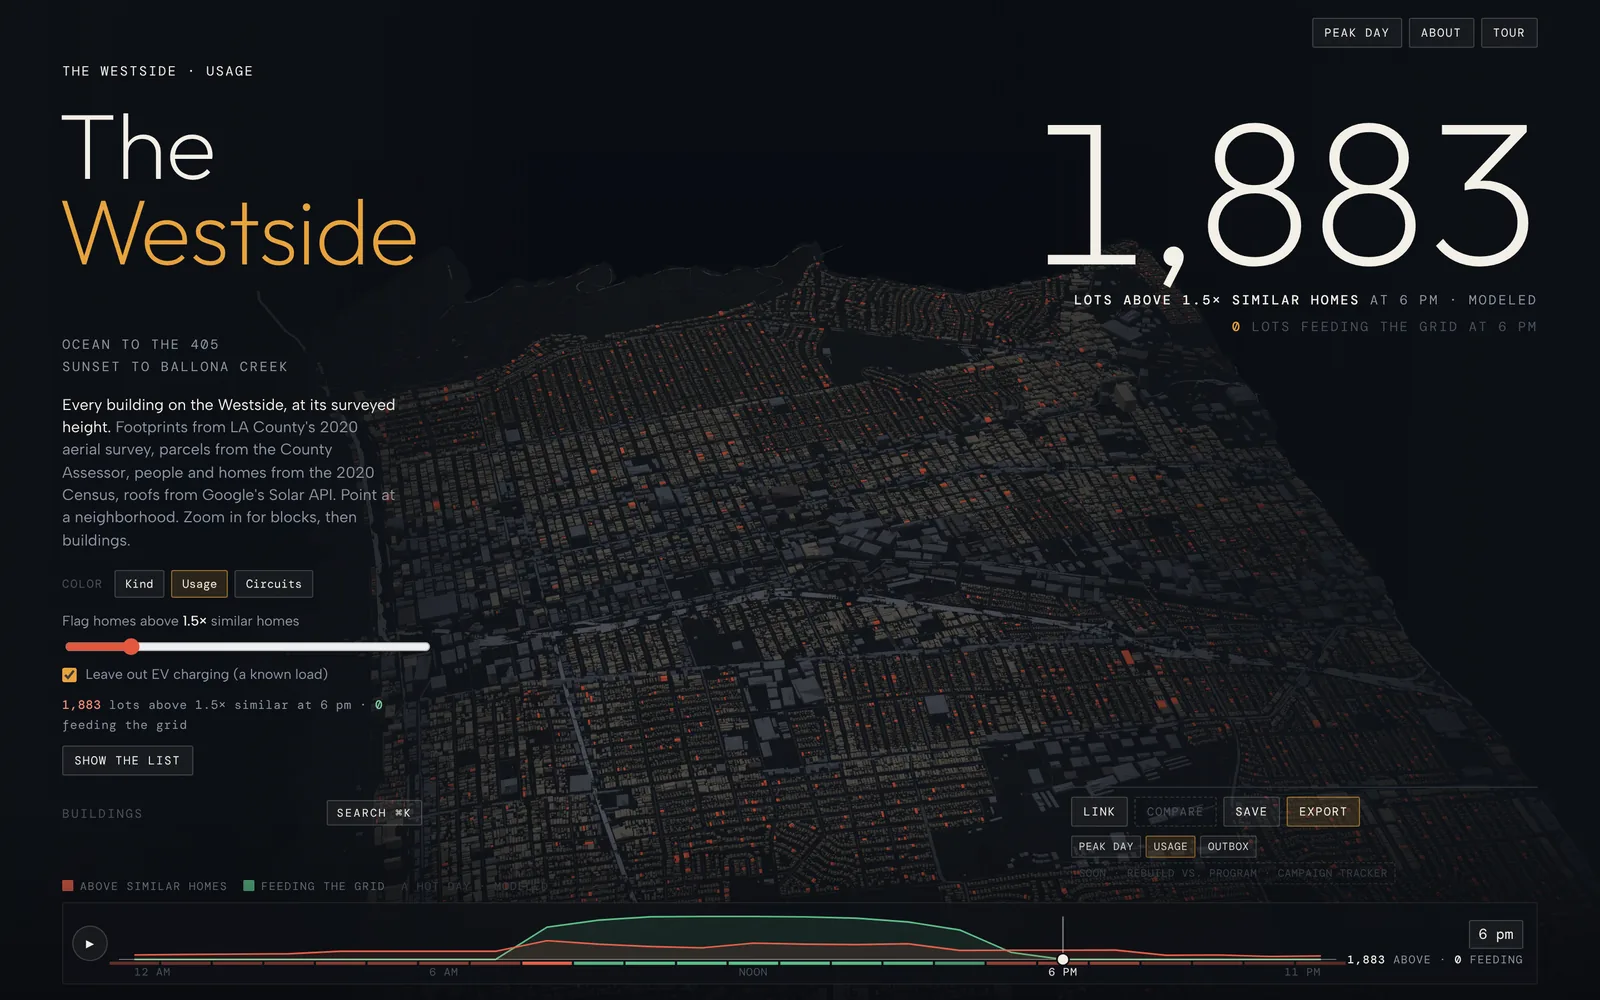
    The Westside

    A distribution planner’s view of the Westside of Los Angeles. Every building at its surveyed height, modeled evening load by home, and a peak-day plan that shows which programs keep a circuit under its rating.

    • Public dataset
    • 1 LookML explore
    • 68,829 buildings

Underneath the apps

The data work behind every screen

Astrodata is a data and AI consultancy. Most of our work is the part nobody sees: platforms, pipelines, models and metric definitions for teams that need their numbers to hold up. These apps put that work in front of you, on a single screen.

  1. 01

    Platforms and pipelines

    We build and run data platforms on Snowflake, BigQuery and Databricks, and we are a Snowflake Premier partner. The data behind an app lands, refreshes and gets checked the same way it does on a client platform.

  2. 02

    Models and metrics

    Every metric is defined once in dbt and tested before it reaches a screen. For Clever, we brought their metric definitions together in dbt on Snowflake and handed over a reporting suite their team runs on its own.

  3. 03

    LookML models

    The app and every Looker dashboard read the same LookML, under the same permissions, so they agree. It is the same discipline we bring to embedded analytics on Omni, where we rebuilt WorkRamp’s customer-facing analytics in under three months.

  4. 04

    The screen

    We design for the person who has to act on the number, usually not an analyst. The number, the reason behind it and the next step sit together, and every figure can be traced back to its rows.

Teams we build for

Read the case studies
  • BetterHelp
  • Clever
  • WorkRamp
  • Turquoise Health
  • CB Insights
  • CarGurus

What changes on Looker

Same app, different foundation

The screens are the same apps you can open on our Omni page. What changes is underneath: the data model, the sandbox the app runs in, and where its media comes from.

  1. 01

    Modeled in LookML

    Every table behind an app becomes a LookML view and explore. The app queries the explores, never the warehouse directly, so row-level security and model permissions apply to every number on the screen.

  2. 02

    Everything ships with the app

    A Looker Data App runs in a locked sandbox: no outside images, fonts or video. Fonts and photos travel inside the app, and heavier media arrives through a query like any other data.

  3. 03

    One interface, two platforms

    The same app code runs in Omni and in Looker; only the data connection changes. Teams on either platform get the same product, and switching later does not mean starting over.

Running Looker? Your models can carry an app like these.

Talk to an expert